Combine Modified CD Optical Assembly, PSoC for High-Resolution Microgram Measurements
Download this article in PDF format.
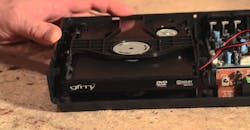
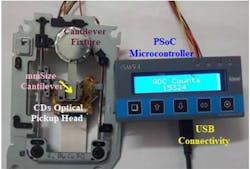
The ability to measure microgram and milligram masses with extremely high accuracy is often critical in pharmaceutical and chemical industries. This design combines a pickup head from a compact-disc (CD) system and a millimeter-sized cantilever mounted on the CD’s optical pickup head (OPH) to build an alternative, cost-effective microbalance. This simple setup interfaces to a personal computer through a PSoC microcontroller for read out (Fig. 1).
1. The microbalance setup uses a standard CD’s optical pick-up head with an attached millimeter-size cantilever supported with a PSoC embedded design.
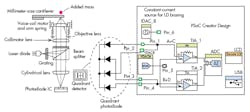
Since the CD OPH is designed to measure the variation in the reflecting surface of CD, this design offers resolution of better than 2 μm for the displacement of the added cantilever, which is 25 mm long, 6 mm wide, and 0.43 mm thick (Fig. 2). It offers microgram-scale accuracy at lower cost and with greater sensitivity than microbalances based on the piezoelectric effect.
2. Shown is the CD’s optical pick-up head mounted with millimeter-size cantilever (this is the key element of this mass sensor arrangement) connected with an embedded PSoC design functioning as a microbalance.
In normal CD-player operation, the unit’s OPH laser diode (780 nm) uses a linearly polarizing beam splitter, collimator, objective lens, and anamorphic lens placed in front of the detector array, plus a focusing voice coil and its drive motor. The laser beam is directed to the specimen via the objective lens, which is actuated by the voice-coil motors. The CD surface, in turn, scatters the beam back through the objective lens to the beam splitter, where it’s directed via the anamorphic lens onto the four-quadrant photodiode (QPD).
From the characteristics of the anamorphic lens, the beam shape at the detector array appears as either elliptic or circular. The circular shape occurs only if the reflective surface of the specimen is placed exactly at the focal plane of the optical path.
3. LabVIEW front panel screen for a typical mass measurement.
Here, light reaches the QPD via a small piece of reflective foil in place of the CD, and the outputs of the QPD indicate the deflection of the cantilever beam. The differential output signal [(A+C) - (B+D)] represents the error signal from the QPD detector and is the deviation signal from the concentric circular laser beam spot due to cantilever displacement. This output is converted into digital format and displayed using Laboratory Virtual Instrumentation Engineering Workbench (LabVIEW) (Fig. 3), and was programmed on a single-chip PSoC microcontroller that supports the required analog and digital blocks (Fig. 4 and Code Listing).
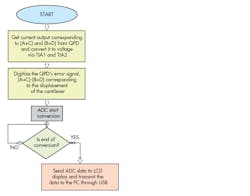
4. The flow chart shows how the readings from the QPD are converted into mass-related ADC counts, which are then used by the PSoC display.
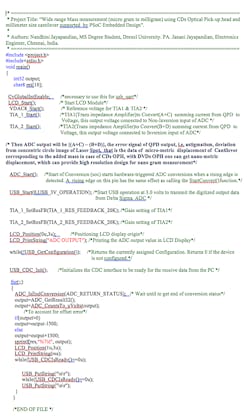
PSoC Creator programming code list for the CD’s OPH read-out.
Test and Evaluation
Tiny pieces of copper from stranded wire were used for evaluation. When no mass is added on the cantilever attached above the OPH, the ADC count is 13,890. Test mass was calculated using measured pieces of a wire strand with 0.30025-mm radius, so the volume of a cut piece is [(πr2) × l] (where r is the strand’s radius and l is its length).

Estimated copper-strand mass and the corresponding ADC counts as obtained via deflection of the attached cantilever.
The table shows the estimated mass for various lengths of copper (copper density is 8960 kg/m3) and the corresponding ADC measurement counts in the PSoC design, as obtained through cantilever deflection. Figure 5 plots this data and inidcates the linearity achieved.
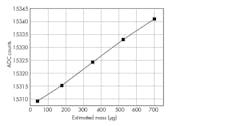
5. The plot shows the PSoC ADC counts from a PSoC embedded design versus the estimated mass for various lengths of copper-wire strand (radius is 0.30025 mm).
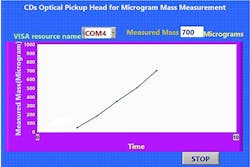
Tiny rectangular pieces of notebook paper were also used, with masses in the range of 75 to 700 μg. The mass of each piece was estimated from the basic formula of mass = paper-piece volume × ρ, where ρ is the density of the paper material (here, 250 kg/m3). The ADC count of the PSoC read-out interface versus mass is plotted in Figure 6.
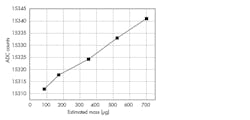
6. Mass measurement of tiny paper rectangles of measured volume (length × breadth × thickness) with resultant estimated mass plotted versus the PSoC ADC counts.
These measurements confirm the successful operation of this microgram mass balance in ambient environment with a wider dynamic range of measurement by exploiting the cost-effective optical pickup head of a CD drive. For improved performance, the entire assembly can be placed inside a transparent desiccator chamber. In principle, this mass-measurement approach can be extended to measure nanogram-level displacements by using a Blu-ray CD with its 405-nm laser in place of the 780-nm laser of the standard CD unit.
Nandhini Jayapandian is pursuing her Master’s in engineering at Drexel University, Philadelphia, Pa. Janani Jayapandian is a software analyst and an engineering graduate in Electronics & Communication Engineering from Sathyabama University, Chennai, India. Their interests include embedded designs using PSoC, VLSI designs for automation of experiments and Industrial equipment, and MEMS sensors and Virtual Instrument Programming using LabVIEW.
References
Yuan-Chin Lee, Shiuh Chao, “A Compact and Low- Cost Optical Microscope,” IEEE Transactions on Magnets, Volume 50, Issue 7, July 2014).
G Gerstorfer, BG Zagar, “Development of a Low-Cost Measurement System for Cutting Edge Profile Detection,” Chinese Optics Letters, 2011.
“Measuring the Deflection of the Cantilever in Atomic Force Microscope with an Optical Pick up System,” 45th IEEE Conference on Decision & Control, December 13-15, 2006.

About the Author
Nandhini Jayapandian
Nandhini Jayapandian is pursuing her Master’s in engineering at Drexel University, Philadelphia, Pa. Interests include embedded designs using PSoC, VLSI designs for automation of experiments and Industrial equipment, and MEMS sensors and Virtual Instrument Programming using LabVIEW.
Janani Jayapandian
Software Analyst
Janani Jayapandian ([email protected]) is a software analyst and an engineering graduate in Electronics & Communication Engineering from Sathyabama University, Chennai, India. Interests include embedded designs using PSoC, VLSI designs for automation of experiments and Industrial equipment, and MEMS sensors and Virtual Instrument Programming using LabVIEW.
Comment About the Article
To join the conversation, and become an exclusive member of Electronic Design, create an account today!

Leaders relevant to this article: