Turn Real-Time Trace Data into Something Useful

This article is part of TechXchange: Trace Debugging Techniques
Download the PDF of this article.
Trace tools are one way to track the operation of applications in real time, unlike most debuggers that require an application to be stopped to examine its state. Breakpoints can facilitate the process; they can allow a developer to step through code to isolate where a problem is occurring, so corrective measures can be taken.
Unfortunately, stopping an application isn’t always a viable option. Bad things happen when a motor control program stops while the rotor is still turning. Self-driving cars tend to do bad things if the software just stops, even for a fraction of a nanosecond. Network protocols usually time out if one side doesn’t respond quickly enough.
The problem with trace tools is that they generate lots of data (see figure). One tool that helps to turn tons of system trace dumps into useful analysis for real-time debugging is Percepio’s Traceanalyzer. It uses hooks into operating systems like Linux and RTOSes like FreeRTOS, Keil’s new RTX5, and Express Logic’s ThreadX, which is used on Renesas’ Synergy family of microcontrollers.
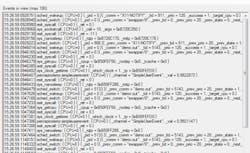
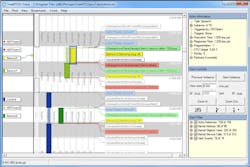
Would you rather analyze a text dump (top) or have a trace tool like Traceanalyzer (bottom) handle the analysis and present more useful insight into an application?
For Linux, Percepio took advantage of the LTTng Project’s Linux Trace Tool (LTT). LTT instruments Linux to provide details about the operating system and applications, giving developers insight into how tasks are performing and what resources they are using. Traceanalyzer requires similar instrumentation for it to work with other operating systems. This support is often already available as with ThreadX, which is also supported by Express Logic’s own TraceX.
Now, one might think that a simple graphical presentation of trace information with some basic filtering would provide everything a developer would need. The truth is much different, especially when multiple threads, cores, and services come into play. Likewise, the trace information can be used to pinpoint issues from deadlock to race conditions. Sometimes a developer can catch this by looking at more basic presentations, but having the trace tool do more analysis before presenting the data makes much more sense—hence the plethora of options and presentation graphics (more than 25 different views) that Traceanalyzer provides.
Other challenges with trace tools relate to whether they are post-debugging tools or real-time tools that are working off very recently generated data. For example, LTTng can be configured with a ring-buffer that is filled continuously and streamed to a debug host running the trace analysis tools.
The biggest challenge for developers unfamiliar with trace tools is understanding how they work and refining the techniques to obtain the desired information. This is akin to learning the use of a conventional debugger. Of course, one needs to use these tools to gain their advantages.
On the plus side, trace tools have the advantage of providing analysis mechanisms to identify normal and abnormal operations, making a developer’s job easier. In many ways, this is similar to learning how to use of an oscilloscope or logic analyzer. It is easy to get started but it can take a long time to master. Good trace tools are invaluable in this age of networked, multicore system-on-chip (SoC) platforms that link IoT devices and the cloud, as well as deeply embedded real-time applications like motor control.
Read more articles in TechXchange: Trace Debugging Techniques

About the Author
William Wong Blog
Senior Content Director
Bill's latest articles are listed on this author page, William G. Wong.
The latest blogs have been moved to alt.embedded on Electronic Design.
Bill Wong covers Digital, Embedded, Systems and Software topics at Electronic Design. He writes a number of columns, including Lab Bench and alt.embedded, plus Bill's Workbench hands-on column. Bill is a Georgia Tech alumni with a B.S in Electrical Engineering and a master's degree in computer science for Rutgers, The State University of New Jersey.
He has written a dozen books and was the first Director of PC Labs at PC Magazine. He has worked in the computer and publication industry for almost 40 years and has been with Electronic Design since 2000. He helps run the Mercer Science and Engineering Fair in Mercer County, NJ.
- Check out more articles by Bill Wong on Electronic Design
- Bill Wong on Facebook
- @AltEmbedded on Twitter
Comment About the Article
To join the conversation, and become an exclusive member of Electronic Design, create an account today!

Leaders relevant to this article: