Download this article in .PDF format
Intermodulation distortion is one of the most interesting signal analyzer measurements. Often abbreviated IMD, it is an important metric of linearity for a wide range of RF and microwave components. Fundamentally, IMD describes the ratio (in dB) between the power of fundamental tones and third-order distortion products.
Third-Order Distortion Products
IMD measurement starts with injecting a two-tone signal into a device under test (DUT). As an example, we’ll consider the behavior of an RF power amplifier. A perfectly linear amplifier would produce an output signal that includes two tones at the exact same frequencies as the input signal, but at the amplified output power. By contrast, a more realistic amplifier (i.e., one with some level of nonlinearity) will produce additional signal content at frequencies other than the two input tones at its output.
Related Articles
- VNAs: The Myth, The Mystery, The Electromagnetics
- What's Inside Your RF Signal Analyzer?
- Instrumentation Improves RF Microwave Simulation
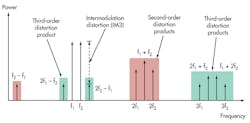
For instance, it’s well known that nonlinearity leads to harmonics that occur at multiples of each input tone. What’s interesting in the two-tone case is that a nonlinear device will produce frequency content at an even wider range of frequencies (Fig. 1).
Second harmonics occur at multiples of the fundamental tones, and we can observe them at frequencies such as 2f1 and 2f2. Of course, we’ll find third harmonics at 3f1 and 3f2. In addition, the system will produce second-order and third-order distortion products at every combination of first-order and second-order products. Thus, in addition to harmonics, second-order distortion products will occur at f2 – f1 and f1 + f2.
Two of the most challenging distortion products are the signal content due to third-order distortion that occurs directly adjacent to the two input tones at 2f1 –f2 and2f2 –f1. IMD measurement, then, describes the power ratio between the power level of output fundamental tones (f2 and f1) and third-order distortion products (2f1 –f2 and2f2 –f1).
Note that IMD is problematic in RF and microwave systems for a range of reasons. In modulated signals, third-order distortion creates additional frequency content often called “spectral regrowth” in bands adjacent to the modulated signal. In a transmitter, spectral regrowth resulting from poor linearity can interfere with other wireless channels. In a receiver, by contrast, it can cause out-of-band signals to obscure the signal of interest.
Third-Order Intercept
It is important to understand that the IMD ratio greatly depends on the power level of the fundamental input tones. As a result, a related measurement known as third-order intercept (TOI) is also used to specify device characteristics. The fundamental principle of TOI is that for every 1-dB increase in the power of the input tones, the third-order products will increase by 3 dB.
So as one continues to increase the power level of a two-tone stimulus, the IMD ratio will decrease as a function of input power. At some arbitrarily high input power level, the third-order distortion products would theoretically be equal in power to the fundamental tones. This theoretical power level at which first-order and third-order products are equal in power is called the third-order intercept.
TOI, called IP3 (intercept point of the third order), is a useful specification that combines the notion of IMD with the power level at which it was measured. TOI is always calculated as a function of IMD:
TOI = (IMD/2) + power
Making Accurate IMD Measurements
Today, many RF signal analyzers come with an IMD measurement mode that automatically detects the fundamental and third-order distortion signals and calculates both their ratio and the resulting TOI. However, the hardware configuration for the IMD measurement setup requires the most attention.
While we’ll mainly focus on the signal analyzer side here, recognize that configuring the two-tone source is often a complex element of measuring IMD. Most IMD measurement setups use two signal generators that are combined with an RF power combiner. The best setups include an isolator between each signal generator and the combiner to produce the cleanest possible two-tone source (Fig. 2).
For the most difficult IMD measurements, where the third-order distortion products are extremely small and the IMD ratio is high, careful attention to the RF signal analyzer settings is essential. The RF signal analyzer includes a mixer directly after its programmable attenuator. This mixer, while being an essential element to downconversion, will behave nonlinearly at higher power levels (see “Understanding Signal Analyzer Architectures”).
One might think that a simple approach to preserving the linearity of the RF signal analyzer would be to increase the amount of programmable attenuation before the mixer. Since IMD is directly correlated to input power level and attenuators reduce power level, this would allow the mixer to operate in a more linear region of operation.
While increasing attenuation would certainly reduce the IMD contribution of the RF signal analyzer, it would also affect its noise floor. If one applies too much attenuation, the third-order distortion products one is trying to measure will be undetectable because they will fall below the noise floor of the instrument.
Practical Tips
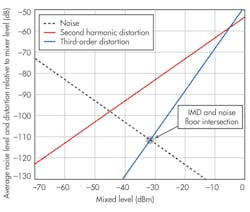
As a result of these characteristics, the dynamic range chart is one of the most critical guides to RF signal analyzer performance (Fig. 3). Using this chart, one can identify exactly how much attenuation one should use to ensure the highest quality measurement.
The inherent third-order distortion of an RF signal analyzer and its noise floor are directly related to the mixer level of the instrument. Mixer level is defined as the signal power present at the input of the first mixer and is determined by both the input power at the RF connector and the amount of attenuation being used.
At the intersection of IMD and noise floor, the instrument’s own inherent third-order distortion products are equal in power to the noise floor. When configuring the instrument to have a mixer level that is lower than this intersection, the results will be noise limited. By contrast, configuring the instrument to have a mixer level that is higher than the intersection point, IMD measurements will be linearity limited. Thus, maximizing an instrument’s dynamic range for IMD measurements requires us to configure a mixer level that is right at this intersection point.
Note that if one doesn’t have access to the instrument’s dynamic range chart, identifying the ideal operating point manually is fairly straightforward. With the test signal connected to the signal analyzer, slowly begin to increase the amount of attenuation. If the power of the third-order intermodulation (IM3) products decreases with an increase in attenuation, then you know the instrument is operating in a linearity-limited region.
By contrast, if the power of the IM3 products does not change, then you know the instrument is likely in the noise-limited region of its operating range. Generally, the ideal instrument configuration is such that the configured attenuation is a few dB higher than the attenuation level where IM3 no longer changes as a function of attenuation.
Parting Thoughts
Distortion measurements such as IMD and the related TOI result are some of the most interesting and important measurements that one can make with an RF signal analyzer. While the theory of these measurements might seem complex at first, one can perform accurate IMD measurements with a working knowledge of RF signal analyzer architectures. For more detailed on measurement best practices using RF signal analyzers, visit www.ni.com/rf-academy/.
David A. Hall is a senior product marketing manager at National Instruments, where he is responsible for RF and wireless test hardware and software products. His job functions include educating customers on RF test techniques, product management, and developing product demos. His areas of expertise include instrumentation architecture, digital signal processing, and test techniques for cellular and wireless connectivity devices. He holds a BS degree with honors in computer engineering from Penn State University.
About the Author
David Hall
Head of Semiconductor Marketing
David A. Hall is the head of semiconductor marketing at NI and is responsible for developing and executing go-to-market plans for the semiconductor industry. His job functions include managing the semiconductor test business, identifying industry trends, and educating customers on best semiconductor test practices. Hall’s areas of expertise include ATE architectures, RF measurement techniques, digital signal processing, and best measurement practices for mobile and wireless connectivity devices.
With nearly 15 years of experience at NI, Hall has served in multiple roles throughout his career including applications engineering, product management, and product marketing for automated test and RF instruments. He has also held management positions in product marketing, which focused on employee development and meeting business results across products and application areas. Hall is a known expert on subjects such as 5G, the Internet of Things (IoT), autonomous vehicles, and software-defined instrumentation. He holds a Bachelor’s with honors in computer engineering from Penn State University.


