Understanding Wireless Range Calculations
Download this article in .PDF format
One of the key calculations in any wireless design is range, the maximum distance between transmitter and receiver for normal operation. This article identifies the factors involved in calculating range and shows how to estimate range to ensure a reliable communications link.
Why Actual Range May Not Equal Stated Range
Have you ever purchased a wireless radio for an embedded project and discovered that you didn’t achieve the radio frequency (RF) range stated in the datasheet? Why is that? It’s probably due to differences between how the supplier measured the range and how you are using the radio.
Suppliers usually determine range by deriving it empirically from real-world tests or by using a calculation. Either approach is fine as long as you account for all variables. An empirical solution, however, may reveal real-world situations that calculations don’t address.
Before we compare the approaches, let’s define a few terms to understand a manufacturer’s numbers or relevant variables for range.
Power And dBm Calculations
RF power is most commonly expressed and measured in decibels with a milliwatt reference, or dBm. A decibel is a logarithmic unit that is a ratio of the power of the system to some reference. A decibel value of 0 is equivalent to a ratio of 1. Decibel-milliwatt is the output power in decibels referenced to 1 mW.
Since dBm is based on a logarithmic scale, it is an absolute power measurement. For every increase of 3 dBm there is roughly twice the output power, and every increase of 10 dBm represents a tenfold increase in power. 10 dBm (10 mW) is 10 times more powerful than 0 dBm (1 mW), and 20 dBm (100 mW) is 10 times more powerful than 10 dBm.
You can convert between mW and dBm using the following formulas:
P(dBm) = 10 · log10(P(mW))
P(mW) = 10(P(dBm)/10)
For example, a power of 2.5 mW in dBm is:
dBm = 10log2.5 = 3.979
or about 4 dBm. A dBm value of 7 dBm in mW of power is:
P = 107/10 = 100.7 = 5 mW
Path Loss
Path loss is the reduction in power density that occurs as a radio wave propagates over a distance. The primary factor in path loss is the decrease in signal strength over distance of the radio waves themselves. Radio waves follow an inverse square law for power density: the power density is proportional to the inverse square of the distance. Every time you double the distance, you receive only one-fourth the power. This means that every 6-dBm increase in output power doubles the possible distance that is achievable.
Besides transmitter power, another factor affecting range is receiver sensitivity. It is usually expressed in –dBm. Since both output power and receiver sensitivity are stated in dBm, you can use simple addition and subtraction to calculate the maximum path loss that a system can incur:
Maximum path loss = transmit power – receiver sensitivity + gains – losses
Gains include any gains resulting from directional transmit and/or receive antennas. Antenna gains are usually expressed in dBi referenced to an isotropic antenna. Losses include any filter or cable attenuation or known environmental conditions. This relationship can also be stated as a link budget, which is the accounting of all gains and losses of a system to measure the signal strength at the receiver:
Received power = transmit power + gains – losses
The goal is to make the received power greater than the receiver sensitivity.
In free space (an ideal condition), the inverse square law is the only factor affecting range. In the real world, however, the range also can be degraded by other factors:
• Obstacles such as walls, trees, and hills can cause significant signal loss.
• Water in the air (humidity) can absorb RF energy.
• Metal objects can reflect radio waves, creating new versions of the signal. These multiple waves reach the receiver at different times and destructively (and sometimes constructively) interfere with themselves. This is called multipath.
Fade Margin
There are many formulas for quantifying these obstacles. When publishing range numbers, however, manufacturers often ignore obstacles and state only a line-of-sight (LOS) or ideal path range number. In fairness to the manufacturer, it’s impossible to know all the environments where a radio may be used, so it’s impossible to calculate the specific range one might achieve. Manufacturers will sometimes include a fade margin into their calculation to provide for such environmental conditions. Thus, the equation for distance calculations becomes:
Maximum path loss = transmit power – receiver sensitivity + gains – losses – fade margin
Fade margin is an allowance a system designer includes to account for unknown variables. The higher the fade margin, the better the overall link quality will be. With a fade margin set to zero, the link budget is still valid, only in LOS conditions, which is not very practical for most designs. The amount of fade margin to include in a calculation depends on the environment in which the system is expected to be deployed. A fade margin of 12 dBm is good, but a better number would be 20 to 30 dBm.
As an example, assume a transmit power of 20 dBm, a receiver sensitivity of –100 dBm, receive antenna gain of 6 dBi, transmit antenna gain of 6 dBi, and a fade margin of 12 dB. Cable loss is negligible:
Maximum path loss = transmit power – receiver sensitivity + gains – losses – fade margin
V – maximum path loss = 20 – (–100) + 12 – 12 = 120 dB
Once the maximum path loss has been found, you can find the range from the formula:
Distance (km) = 10(maximum path loss – 32.44 – 20log(f))/20
where f = frequency in MHz. For example, if the maximum path loss is 120 dB at a frequency of 2.45 GHz or 2450 MHz, the range will be:
Distance (km) = 10(120 – 32.44 – 67.78)/20 = 9.735 km
Figure 1 shows the relationship between the maximum path loss and range at a frequency of 2.45 GHz.
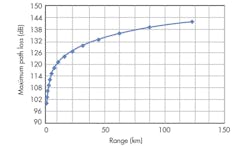
1. The curve shows the relationship between the link budget or maximum path loss in dBm and estimated range in kilometers.
Interpreting Empirical Results
While empirical methods are very useful in determining the range, it often is difficult to achieve ideal LOS for real-world measurements and difficult to understand how much fade margin to build into a system. Measured results can help identify issues beyond RF propagation that may affect the range of a system, such as multipath propagation, interference, and RF absorption. But not all real-world tests are the same, so real-world measurements should be used primarily to bolster the link budget numbers calculated above.
Factors that can influence the range achieved in an empirical test include antenna gain, antenna height, and interference. Antenna gain is a key source of gain in the system. Often manufacturers will certify their radio to work with different types of antennas from high-gain Yagi and patch antennas to more moderate-gain omnidirectional antennas. It is important to ensure tests were performed with the same type of antenna with which you are now using the radio. Changing from a 6-dBm antenna to a 3-dBm antenna on both the transmit and receive side will cause a 6-dBm difference in the link budget and reduce the range by half.
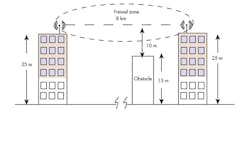
Antenna Height And The Fresnel Zone
Antenna height is another concern for empirical measurements. Raising the height of an antenna does two main things. First, it can help get you above any possible obstructions like cars, people, trees, and buildings. Second, it can help get your true RF LOS signal path at least 60% clearance in the Fresnel zone.
The Fresnel zone is an ellipsoid volume between the transmitter and receiver whose area is defined by the wavelength of the signal. It is a calculated area that strives to account for the blockage or diffraction of radio waves. It’s used to calculate the proper clearance a signal should have around obstacles to achieve optimal signal strength. A general rule of thumb is to have the LOS path clear above the obstacles that are no more than 60% of the antenna height.
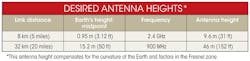
The curvature of the Earth can also impact LOS for long-range wireless links. The table provides some examples of the impact, where the Earth’s height at the midpoint of the link path does not account for hills or other terrain features and the antenna height achieves a signal that is at least 60% in the Fresnel zone.
In many practical settings, your transceivers may function with a lower antenna height, but it is a good bet that the manufacturers place their antennas at an appropriate height. For your application, you should strive to have an appropriate antenna height to achieve the best range. Figure 2 illustrates how path distance, obstacle height, and antenna height are related to the Fresnel zone.
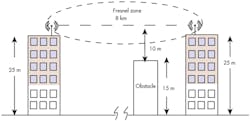
2. The desired antenna height is determined by the obstacle height and factoring in 60% margin to compensate for the Fresnel zone conditions.
Finally, noise and interference can have a negative impact on the range of a wireless system. Noise cannot be controlled but should be factored into the range if it is an issue. In the industrial, scientific, and medical (ISM) bands at 902 to 928 MHz (North America) and 2.4 GHz (worldwide), interference can often be expected, but accounting for it is difficult. Manufacturers may perform empirical tests only when interference is not present. It certainly is likely that your environment has greater interference than was present during the manufacturer’s testing.
Summary
With so many variables in a system, how can you know whether the range claimed by a manufacturer will apply to your system? Often it is impossible to know whether tests were performed empirically or if the range numbers were calculated. Either way, by analyzing the maximum transmit power and the receiver sensitivity, you can generate a baseline to compare one radio to the next. Using these numbers, along with a set fade margin and any gains due to antennas or losses due to RF cables, you can calculate a maximum link budget. Then use the distance equation above to calculate your own range. For various radio devices, this should provide a good baseline to compare two or three systems that meet your needs.
To understand if the radios will work in your application, you should strive for accurate real-world tests that can account for antenna height, multipath, interference, and obstructions. Delaying real-world tests for your application and only taking the manufacturer’s numbers verbatim may leave you asking, “What’s my range?”
Chris Downey has been with Laird Technologies since 2007. He has been responsible for the network design and troubleshooting for a Tier 1 data communications network and systems administration in a nationwide enterprise network. Previously, he was a field applications engineer for embedded wireless modules. He is currently a product manager for wireless modules at the facility in Lenexa, Kan. He has a BS in electrical engineering.
About the Author
Chris Downey
Product Manager
Chris Downey has been with Laird Technologies since 2007. He has been responsible for the network design and troubleshooting for a Tier 1 data communications network and systems administration in a nationwide enterprise network. Previously, he was a field applications engineer for embedded wireless modules. He is currently a product manager for wireless modules at the facility in Lenexa, Kan. He has a BS in electrical engineering.
Comment About the Article
To join the conversation, and become an exclusive member of Electronic Design, create an account today!

Leaders relevant to this article: