Portable media devices have changed the way we interact with each other on a daily basis. In fact, there’s now a generation of users who grew up with some type of touchscreen device. As a result, the user interface (UI) isn’t a considered “new” tool—it’s turned into a common feature of mobile devices.
This latest generation of users has created a new set of expectations. It means any device with an LCD must offer a fluid and intuitive UI experience. It’s also expected that the touchscreen be “smartphone-like” whenever the device is powered on. Embedded-system developers are now under pressure across multiple markets and device types to replicate the smartphone UI interactive experience.
The importance of getting the UI right is absolutely critical to the success of the device. Underpinning documented UI design methodologies is the requirement for the device to operate in a way so that it will not impinge or be detrimental to the user experience. For developers, it’s necessary to understand the types of performance problems a typical end user might encounter, and through an understanding of performance metrics, employ various analyses to highlight the bottlenecks and performance-degradation issues.
Typical Performance Issues
To understand how to best analyze performance, it’s important to look at common performance issues from the end user’s perspective. In identifying these issues, developers can begin to determine the first data points or metrics needed for feedback on system performance.
The most common end-user performance issues include:
Responsiveness
Responsiveness can be thought of as the time it takes for the user to receive feedback from the UI as a result of an input action made. Typically, this consists of a touchscreen input, but also includes hard key presses. Responsiveness is important, because the user must feel the device perform within a certain time frame to avoid the feeling of a UI that’s “laggy” or slow to respond. Delays in updating the UI in response to input can result in frustration and mistakes made by the user.
Animation smoothness
Animation smoothness relates to the visible motion or change in appearance of elements displayed within the UI. As an element transitions from one point in 3D space to another, does it do so in a smooth manner that’s pleasing to the eye? Animation smoothness is important because if the user perceives jagged or staggered motion in a transition, it will degrade the overall interactive experience.
Startup time
Startup time can be thought of as the time taken from powering on a device until the time the first frame is rendered on screen. The importance of startup time can vary from device to device in the intended application. For functional safety reasons, some devices must render to the display within a few microseconds. In non-safety situations, it’s more about not making the end user wait too long whereby the user becomes frustrated or confused about the operational soundness of the device.
Hardware: Know Your Limits
Before proceeding to the UI performance analysis, it’s important to consider the influence of the hardware on the system. Advances in the capabilities of hardware are well-documented; the trend of the system-on-chip (SoC) becoming more complex has led to increasing inclusion of a graphics processing unit (GPU) with common hardware choices for today’s embedded systems. It’s essential that embedded UI developers pay careful attention to hardware-platform capabilities.
Hardware limitations regarding the ability to execute the created UI design and functionality are often at the heart of performance problems. Expectations at project kick-off should be set regarding what the hardware is capable of achieving.
How to Analyze UI Performance
Understanding and pinpointing what causes poor UI performance is a difficult task. The issue might manifest itself clearly, but under the hood of today’s highly complex embedded devices, the developer is faced with a host of interrelated subsystems.
Many performance-analysis tools and methods exist, but the tools that provide a holistic view of the system, enabling specific UI aspects to be considered, allow the developer the quickest and most informed route to a solution.
Frequently used methods of system analysis include:
Printf
Printf is the most common and often the default starting point for a developer trying to establish system status. It’s the standard function in the C programming language library for printing formatted string output to a screen or console.
Printf is simple and easy to use, and it will work (almost) everywhere in code. However, it’s inherently slow with poor performance due to string formatting and an input/output over serial cable or to a file. Ultimately, this approach is inefficient from a developer’s perspective because it requires add/rebuild/rerun/edit/rebuild/rerun cycles that are time-consuming and narrow in scope, as it relates to the system, and has the need to post-process string-based output.
Printf is the right tool for displaying output; however, it’s the wrong tool for getting system-wide analysis using performance metrics.
Statistical profiling
Statistical profiling involves taking samples, or snapshots, of the program’s execution over a fixed period of time. Each snapshot gathers program address data that, in turn, can be analyzed to determine where in the code the application is spending the greatest amount of time. Thus, statistical profiling indicates which functions are typically the greatest users of CPU or cache.
Without the need to change code, statistical profiling displays the application unobtrusively. By design, there’s no timeline associated with the data, just a static table aggregating all results. Limited to the utilization of hardware resources only (CPU use), statistical profiling only helps to visualize repeated patterns, where overused functions show up as “hot spots” in the resulting output, and one-off anomalies go undetected.
Tracing
Software tracing can be equated to the process of using printf, but considered much lower level and higher performance in nature. Tracing is historically associated with logging, but it’s technically not logging due to its low-level content and unrestricted output format.
The great difficulty of tracing is post-processing the results. Developers can’t just examine text-based output and hope to find slow or conflicting routines. Tracing, quite literally, provides a huge haystack of data about the application’s execution across multiple layers, but where is the needle? There’s a need to make use of visual feedback for an overview of the system.
Trace viewing
Trace-viewing software gives developers the ability to create visual representations of trace data. Software can show the events graphically with basic features like “search & filter” to help refine the data, making it easier to spot anomalies. Trace viewing is also more effective when representing large sets of data. A graphical representation helps with problem cases that occur on an irregular basis or after a long period of time.
With trace viewing, it’s incumbent upon developers to find a particular pattern. Trace viewing applies fixed or limited data sets for visualization, often limiting developers to hardware metrics such as CPU use and thread state.
An Approach to Solving UI Performance Issues
UI-related visualizations that focus on the commonly experienced performance issues discussed earlier in this article are an ideal approach to solving UI challenges. Visualizations clearly depict performance issues, and provide the starting point in which further visualizations can be aligned and analyzed to help tell the complete story of what’s happening across the full system, and at what point a performance issue occurs.
Analysis tools such as Mentor’s Sourcery CodeBench with Sourcery Analyzer can be used to evaluate the trace data that’s logged during the execution of the application. The tool transforms trace data time and thus provides insight into complex system behavior.
Some of the more helpful UI visualizations include:
Animation smoothness
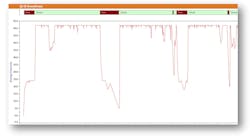
1. Visually checking frame-rate drops can help you pinpoint the problem—and devise a solution.
Measured in frames per second (FPS), this graph (Fig. 1) allows the user to focus on animations within the UI and pinpoint the times that animations fall below a certain frame rate. By doing this, the developer visibly can align the frame-rate dropoff with other system metrics such as task states and CPU load to pinpoint why the system can’t maintain an appropriate frame rate.
Startup time
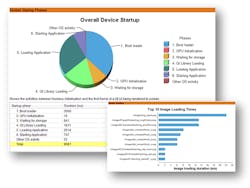
2. A key advantage to system startup is the ability to analyze selected input events.
A detailed visual representation of the startup phases of the UI application (Fig. 2) from the first stages of initialization, until the first frame is rendered on screen, is a key attribute to startup performance. Viewing system startup can range from bootloading, GPU initializing, and storage initialization time, to application and UI design startup. This is critical to UI performance, because being able to view the startup phases broken down into identified segments enables developers to have instant feedback on which startup phase took the most time to execute.
Responsiveness
3. Latency issues can be viewed during selected input levels.
UI responsiveness is used to highlight times when the delay between an input event is occurring, and the subsequent updating of the UI becomes too long. With insight into this visualization (Fig. 3), developers can see when input event processing is taking too long or the Paint latency is high, aligning any slow periods of response with other visualizations from other system layers in a time-correlated manner.
Conclusion
This article has touched on some of the performance metrics developers need to keep in mind when developing a device with a graphical UI. While performance-analysis tools and methods exist, what’s required is an integrated design environment that provides a holistic view of the system, across layers (OS, middleware, application), and with specific UI aspects considered. This type of strategy allows the developer the quickest and most informed route to a powerful UI solution.
About the Author
Phil Brumby
Senior Technical Marketing Engineer, Embedded Systems Division
Phil Brumby is a senior technical marketing engineer in Mentor’s Embedded Systems Division. Phil is responsible for the technical and engineering development of Mentor’s embedded graphics and user-interface product offerings. Prior to working at Mentor, Phil held a number of senior software engineering roles in the user-interface and mobile-gaming spaces. He holds a Master’s in applied computing and a Bachelor of Science with honors in mathematics & statistics from the University of Dundee, Scotland.


