“Why Didn’t I Think of That?”—Seeing Inside Embedded Systems (.PDF Download)
Embedded software developers are quite familiar with using a code editor, a compiler, linker, debugger, and, of course, an evaluation board. Most of the time, these tools are all you need to develop and debug an embedded system. But what do you do when you want to verify the operation of dynamic systems like motor control, process control, chemical processes, flight systems, and more?
Modern processors have specialized debugging hardware that allows tools to display or change memory locations while the target is running. Let’s explore how such debugging hardware can be used to help you visualize the state of your embedded system with little or no CPU intervention, and while the target is running.
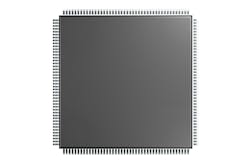
If you’ve been designing embedded systems for a while, you know how complex devices have become and how hard they are to debug. Microcontroller units (MCUs), self-contained devices (black boxes) with on-chip memory, are packed with literally hundreds or even thousands of registers that are used to control the operation of various peripheral devices (Fig. 1).
1. How do you see inside a “black box” device like a microcontroller?
Every toolchain comes with a debugger, which, at a minimum, allows you to stop the target and examine variables and I/O registers (in the watch window) (Fig. 2). Although quite useful when debugging algorithms have no real-time component, this capability is somewhat useless when you can’t afford to stop the target, e.g., motor control, process control, etc.


