What’s The Difference Between The Third-Order Intercept And The 1-dB Compression Points?
There are two key measurements in determining power amplifier quality, efficiency, and linearity: the third-order intercept (abbreviated TOI or IP3) point and the 1-dB compression (P1dB) point. These quantities allow you to evaluate and compare amplifier specifications and performance.
Table of Contents
• Amplifier Performance Characteristics
• 1-dB Compression
• Third-Order Intercept
• Summary
• References
Amplifiers are specified by multiple characteristics including gain, frequency response or bandwidth, power output, linearity, efficiency, noise, and input/output impedances. In wireless applications, linearity is key because of the broadband modulation schemes used today including orthogonal frequency division multiplexing (OFDM), High Speed Packet Access (HSPA), wideband code division multiple access (WCDMA), and others. Furthermore, power output and efficiency are very important as they affect power dissipation and heat and in cellular handsets’ battery life.
This file type includes high resolution graphics and schematics when applicable.
Linear amplifiers operate in class A or class AB. Class A operation is preferred if maximum linearity is desired, but its downside is poor efficiency, never more than 20% to 30% in practice. To achieve greater efficiency, class AB is used. The disadvantage is that class AB biasing introduces signal distortion and produces harmonics and intermodulation products. While proper filtering can eliminate some of these undesired side effects, it cannot reduce all of them. The TOI and the P1dB points can provide a means of assessing amplifier linearity and bias methods.
1-dB Compression
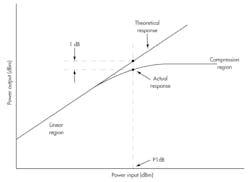
Most linear amplifiers have a fixed gain for a specific frequency range. If you plot output power versus input power, you will see a linear relationship (Fig. 1). The slope of the line is the gain. As the input power continues to increase, at some point the gain begins to decrease. The amplifier goes into compression where no further output increases occur for an input increase. The gain flattens, meaning that at high signal levels, the amplifier becomes saturated. Its response becomes non-linear and produces signal distortion, harmonics, and potentially intermodulation products.
It is important to know at what point compression begins to occur so input levels can be restricted to prevent distortion. That point is usually the input power that causes the gain to decrease 1 dB from the normal linear gain specification. The 1-dB decrease may be specified as the input level that produces it or the output power where the 1-dB drop occurs.
The 1-dB compression point is more commonly used in power amplifier specifications. However, the specification is sometimes used in small signal amplifiers that must handle a wide range of input voltages without distortion.
The 1-dB point is measured by driving the amplifier with a sine wave at the desired signal frequency. The input level is increased while the output power is plotted. The output is usually measured with a vector signal analyzer (VSA) or similar instrument. An attenuator may be needed at the input to control the input level, and an attenuator is usually needed at the output to minimize any potential damage to the VSA input.
Third-Order Intercept
When an amplifier or other circuit becomes non-linear, it will begin to produce harmonics of the amplified inputs. The second, third, and higher harmonics are usually outside of the amplifier bandwidth, so they are usually easy to filter out if they are a problem. However, non-linearity will also produce a mixing effect of two or more signals.
If the signals are close together in frequency, some of the sum and difference frequencies called intermodulation products produced can occur within the bandwidth of the amplifier. These cannot be filtered out, so they will ultimately become interfering signals to the main signals to be amplified. That’s why every effort must be made to control the biasing, signal levels, and other factors to ensure maximum possible linearity, greatly reducing the intermodulation distortion (IMD) products (see “Understanding Intermodulation Distortion Measurements” at www.electronicdesign.com).
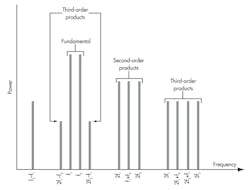
Figure 2 shows two signals f1 and f2 occurring within the amplifier bandwidth. With distortion, new signals f1 – f2 and f1 + f2 are produced. They can usually be filtered out. However, these signals will also mix with the second, third, and higher harmonics to produce a wide range of potentially interfering signals with the amplifier pass band. The most troublesome are the third-order products, which are 2f1 ± f2 and 2f2 ± f1. Those possibly occurring in the amplifier frequency range are 2f1 – f2 and 2f2 – f1.
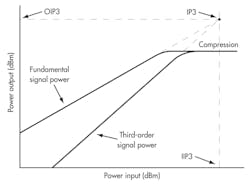
If you plot the output power versus input power, you will get a curve similar to the one used for the 1-dB compression discussion (Fig. 3). This is the first-order signal plot. Note the flattening of the gain curve showing compression. Also plotted on this same graph are the third-order product signal levels. These products increase at a rate three times that of the first-order products on a logarithmic scale because the mathematics of mixing indicates a 3:1 gain rate for the third-order products.
Now if you extend the linear portions of the two gain curves as shown in Figure 3, they will meet at a point where the third-order signals equal the first-order or input signals in amplitude. This is the third-order intercept point. It is a theoretical point that is never achieved in practice. However, it is useful in determining the linearity condition of an amplifier.
The IP3 value can be read with reference to the input or the output. If you read the value from the output axis, it is called OIP3. Reading the value from the input axis, the value is IIP3.
The higher the output at the intercept, the better the linearity and the lower the IMD. The IP3 value essentially indicates how large a signal the amplifier can process before IMD occurs. For example, an IP3 rating of 25 dBm is better than one of 18 dBm. The IP3 point is typically about 10 dB above the 1-dB compression point.
Summary
The 1-dB compression point is important since it shows you the input power point where compression begins and distortion will occur. Amplifiers should be operated below the compression point.
Third-order products are the most troublesome of the intermodulation effects caused by non-linear operation. The IP3 value is an imaginary point that indicates when the amplitude of the third-order products equals the input signals. This point is never reached, as the amplifier will saturate before this condition can occur. Nevertheless, it is a good indicator of amplifier linearity.
References
1. Cripps, Steve C., RF Power Amplifiers for Wireless Communications, Artech House, 1999
2. Frenzel, Louis E., Principles of Electronic Communications Systems, McGraw Hill, 2008
3. National Instruments, white paper: 1 dB Gain Compression Measurement (P1dB), February 2012
4. Pothecary, Nick, Feedforward Linear Power Amplifiers, Artech House, 1999
5. Scott, Allan, Frobenius, Rex, RF Measurements for Cellular Phones and Wireless Data Systems, John Wiley & Sons Inc., 2008
About the Author

Lou Frenzel
Technical Contributing Editor
Lou Frenzel is a Contributing Technology Editor for Electronic Design Magazine where he writes articles and the blog Communique and other online material on the wireless, networking, and communications sectors. Lou interviews executives and engineers, attends conferences, and researches multiple areas. Lou has been writing in some capacity for ED since 2000.
Lou has 25+ years experience in the electronics industry as an engineer and manager. He has held VP level positions with Heathkit, McGraw Hill, and has 9 years of college teaching experience. Lou holds a bachelor’s degree from the University of Houston and a master’s degree from the University of Maryland. He is author of 28 books on computer and electronic subjects and lives in Bulverde, TX with his wife Joan. His website is www.loufrenzel.com.


