Chip-verification teams often confront one fundamental question: “How well is the verification process exercising the design?” Attempts to answer this query have led to the development of several types of coverage metrics for simulation, each producing a numerical percentage of verification completion. However, it’s very rare for any of these metrics to reflect system-level behavior, including which real use-case scenarios have been verified. A new form of system-level coverage derived from graph-based scenario models of the verification space is emerging to fill this gap.
This file type includes high resolution graphics and schematics when applicable.
Early Coverage Metrics
It can be argued that the most basic form of coverage involves checking off which items in a test plan have or have not been completed. Before the introduction of constrained-random stimulus, all simulation testbenches and tests were handwritten. The verification team usually began a project by working its way through the design specification, noting each feature that needed verification, and creating a simple list of tests.
Once the testbench was written, the verification engineers would start working down the list, writing each test, running in simulation, and debugging any failures. Once the test passed, they would check it off (quite literally, in a spreadsheet) and soldier on. The spreadsheet would simply count the number of completed tests versus the total test plan and report a percentage. If 32 of 80 tests were completed, the test plan coverage was at 40%. Verification management would generally insist that all tests pass successfully (for 100% coverage) before taping out the chip.
Naturally, verification engineers worried that they might be missing features. Sometimes, being human, they would simply miss items in the design specification. Other times the spec might be updated with new functionality without anyone notifying the verification team. Conscientious engineers realized the weakness in this system and looked for a way to measure coverage on the design itself. For gate-level designs, this was typically derived from the chip-production test world, e.g., what percentage of signals in the design were toggled both high and low across the set of simulation tests.
The advent of RTL coding for the design enabled the use of code coverage, popular with programmers long before it was adopted by hardware designers. RTL can be considered a programming language, so it was easy to borrow concepts such as line coverage, basic block coverage, branch coverage, and condition coverage from the software world. This provided a backup to the test plan.
However, 100% code coverage was no guarantee of complete verification. Meanwhile, any uncovered code meant that the tests were missing part of the design, possibly due to an inadequate feature list in the test plan.
Advent of Functional Coverage
The status quo changed significantly with the introduction of constrained-random stimulus generation. This approach reduced or eliminated handwritten tests. Instead, the verification team defined the legal input stimulus for the design using a constraint language. An automated tool could then generate a massive number of tests for simulation, varying the inputs over the legal stimulus space. This automation sped up verification and decreased the likelihood of missing design bugs because the team simply forgot about a feature.
The downside of constrained-random is that it loses the connection between features and tests. Each automated test might verify multiple parts of the design, plus there was no longer a list of tests to check off even if the verification team could figure out how. The team needed some way to correlate all of the activity generated by constrained-random testbenches with the design being verified. The solution was functional coverage, which tracks the parts of the design and testbench that were exercised by simulation tests.
The verification team proceeded through the design specification as earlier, but instead of writing down a test name for each feature, it wrote down the name of a cover target. Eventually, the team created a cover property or cover group, most likely in SystemVerilog. In addition, cross-coverage targets were defined, which involved choosing combinations of coverage targets that made the most sense. For example, a network packet might have four possible types and three possible addressing schemes. The verification team might choose to cross these two options and check that all 12 possible combinations occurred over the course of simulation.
In many cases, the coverage targets were annotated back to the spec. The name given to the target was carried onward during coverage implementation, thus providing a link that could be used to back-annotate coverage results into the spec. Then it was easy to look directly at the spec to see which features were exercised in a given test. Further, it was possible to merge together the results from all of the tests to get a view of functional coverage achieved thus far on the project. The verification team could try different random seeds, alter constraints, or otherwise tweak the testbench to try to stimulate uncovered features.
Other Forms of Coverage
Coverage closure, the process of achieving all coverage goals, is an important criterion for taping out a chip. Therefore, the current measure of coverage is one of the best ways to measure progress during the verification phase of a chip project. As mentioned above, the results from multiple tests, whether handwritten or constrained-random, can be merged into a single metric. Verification leads look at code-coverage results and functional-coverage results separately. However, it can also be useful to merge them together to achieve a single number—the percentage of coverage closure—to gauge verification progress.
Once simulation tools began supporting this type of coverage roll-up, it was natural to add other types of coverage into the calculation. As the use of assertions became widespread in simulation, assertion coverage could be automatically captured. For example, many assertions are of the form “A implies B within X clock cycles.” Assertion coverage might count the number of times that this assertion was triggered (A happened) and the number of times that it was satisfied (A happened and then B happened within X cycles). An assertion failure (B not following A within the window) is a test failure that must be debugged.
By adding assertion coverage from simulation, verification teams using formal analysis wanted coverage metrics as well. Formal adds the notion of a proof, but otherwise tracking the ability to trigger and satisfy an assertion is just as valid as for simulation. Beyond software tools, some hardware platforms like accelerators and emulators are able to gather and report some types of coverage. Today, all of these different metrics can be merged, with user-selectable weightings, into a single number that represents the status of the verification effort.
Even with the richness of today’s metrics, they typically don’t cover system-level behavior, such as scenarios that would be run by actual users of the chip. Functional coverage is very effective at determining whether the RTL implementation is being well exercised and whether bus protocols are being put through their paces in the testbench. Code coverage is a useful backup, good at identifying when the specification or the annotation of the spec for coverage is incomplete. However, realistic use cases require higher-level metrics.
System-Level Scenario Coverage
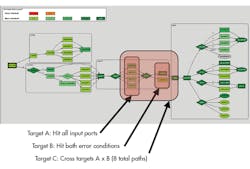
System-level scenario coverage must be measured on a true system-level model. This model must capture user-level scenarios that represent real-world chip usage. It must capture the data flow through the chip and the interaction between the various IP blocks and subsystems that make up the overall chip. One could imagine any number of possible forms for such a model, but graph technology offers a flexible, proven base on which to build a solution. Looking at a typical graph-based scenario model for a system-on-chip (SoC), paths are traced from the inputs on the right to the results on the left (Fig. 1).
Without going into great detail, this graph captures both the chip’s data flow and verification intent. The ovals represent inputs; the rectangles represent actions or functions; and the diamonds are decision points. A test-case generator can walk through this graph from left to right, making a choice at each decision point as it automatically builds a test case to run on the design. Each such path through the graph reflects a realistic use case, and system-level coverage can be automatically generated along with the test case itself. For example, coverage for all branches from a decision point might be very useful.
Figure 1 shows three categories of system-level coverage. The generated metrics can track coverage of all four branches of different input ports and both branches of error conditions. The user specified that these should be tracked and reported, along with the cross-coverage for these two conditions. This covers eight (four times two) paths through this section of the design. During simulation of the generated test cases, the results can be merged and then annotated back on the scenario model. The three shades of green shown on the graph represent different degrees of coverage that were achieved.
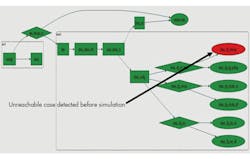
Another advantage of graph-based scenario models is that unreachability can be determined by static analysis, even before generating and running test cases in simulation. Figure 2 shows an example of automatically highlighting an unreachable part of the graph. This may be due to an error in the model, or may be intentional if the user doesn’t want to verify certain parts of the design because the RTL isn’t yet ready. It would not be uncommon for the scenario model to be developed early in the project and thus ahead of the RTL implementation for some period of time.
Achieving Coverage Closure
Closure for system-level coverage is rather different from closure for other metrics. The verification team will try to reach 100% if possible. The graph’s unreachability report is especially valuable during the coverage-closure process. With constrained-random testbenches, it’s not uncommon to spend a great deal of time trying to hit a few coverage targets that are eventually determined to be unreachable by manual analysis. Since scenario models report unreachable coverage directly, these targets can be removed from further consideration.
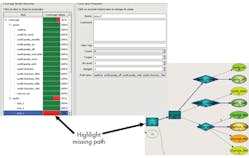
If a portion of the graph is reachable but has not yet been covered by the simulated test cases, it will be reflected in the roll-up. The graph can be automatically annotated to display the missing part (Fig. 3). As in constrained-random testbenches, the user could choose to run many more tests in an attempt to hit the missing coverage. This is not necessary with graphs; the automatically generated test cases are guaranteed to hit all coverage designated by the user. In Figure 1, the user can simply specify that the eight cross-coverage targets must be exercised, and they will be hit in eight generated test cases.
The value of system-level coverage is clear, and the unique advantages of graph-based scenario models make it easier to achieve the desired goals than other forms of coverage. However, functional and code coverage have value as well, and should be turned on when the generated system-level test cases are run in simulation. Naturally, the verification lead will want to include the system-level coverage results in the roll-up report along with the more traditional forms of coverage. This ensures that metrics for use-case scenarios are considered during verification assessment.
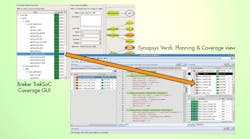
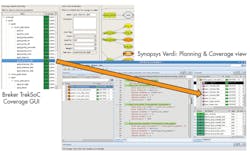
In an example of the roll-up process (Fig. 4), the system-level coverage report on the left is generated by Breker’s TrekSoC product. It has generated a series of test cases from a graph-based scenario model and measured the coverage while these ran in the Synopsys VCS simulator. The right side has a display from the Synopsys open Verdi debug solution that shows the imported system coverage. This integration allows users to expand beyond traditional coverage metrics while retaining their existing methods for gauging verification progress and determining tape-out readiness.
This file type includes high resolution graphics and schematics when applicable.
Conclusions
Coverage metrics have long been used to help verification teams understand how well they verify chip designs. Code coverage, functional coverage, assertion coverage, and formal coverage have all shown their value. System-level coverage derived automatically from graph-based scenario models is an essential complement to traditional metrics for complex chip and SoC designs. The technology exists today to create scenario models; automatically generate coverage goals; automatically generate test cases to hit those goals; and combine system-level metrics with traditional forms of coverage for a comprehensive view of verification.
