I haven’t been programming full time in decades but I regularly work on projects for myself or for open source projects I support. One thing that has not changed over the years is the need for debuggers. There are those that say they don’t need debuggers but they essentially do the same thing but poorly using other techniques like printf.
Program debuggers essentially let you see what is going on inside your application. It can be a joy to use when it shows were a problem is or that your application is actually doing what it is supposed to. It can also get frustrating when you have to spend hours trying to get a program to break before a bug occurs so you can step through to see what the problem is.
I think debugging is an art. It is definitely not something that is taught on a regular basis that I know of. There are some good books on debugging but it is surprising how many programmers don’t know about or don’t use them. There are probably hordes of Javascript programmers that don’t even know about tools like Firebug for the Firefox web browser.
I have been getting back to some Drupal module projects I let linger for years so lately I have been using Eclipse with PDT (PHP Development Tools) and Xdebug, a PHP debugger. The application generates some interesting HTML and Javascript so Firebug comes in quite handy. I could use JSDT (Javascript Development Tools) but familiarity and ease of set up of Firebug makes it part of the combo I use. I may try out JSDT just to see what it offers.
Actually, hitting roadblocks like complexity of set up or trying to find documentation is why I often skip over some tools. I had trouble getting the Zend PHP debugger to work so Xdebug was the choice as that worked the first time. What is frustrating about the tools is that it sometimes takes some debugging to figure out why something does not work and how to fix it. The Internet has made the job easier but finding a comment or article about a particular problem is a search art.
I also had to get Git working since that is the repository that Drupal uses these days. I have downloaded projects using Git but have not had to upload stuff using it until now. No surprises here as Git is integrated with Eclipse. I am hoping to get an alpha version up in another week.
But back to debuggers.
Not much has changed over the years. I grew up with hex debuggers when working with assembly language so I have seen a lot of changes but once integration with the IDE was done with source code debugging the new feature introduction seems to have slowed.
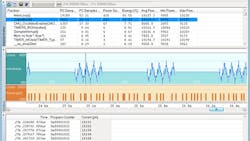
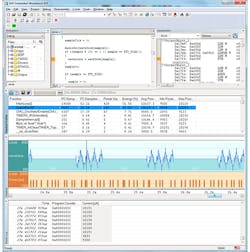
There are some notable enhancements like IAR’s (Fig. 1) power related debug features (see “Power Debugger Finds Hot Spots”) that track power utilization. This is useful for power critical applications like mobile devices that have battery limitations. This type of feature is more common these days as microcontroller vendors highlight they lower power processors.
Figure 1. IARâ's power debugging enhancements let developers track power utilization via real time traces.
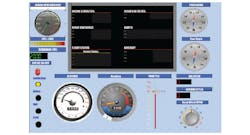
Micrium’s µC/Probe (Fig. 2) is one instance of an enhancement that would be useful in other debug environments (see “Visual Debugging Hooks Into Your Applications”). The µC/Probe tool adds a GUI front end to the usual text-based watch variable window. There is an Eclipse plugin but it only works with Windows. Unfortunately I do most of my work on Linux. The µC/Probe has support for Cypress Semiconductors’ PSoC.
Developers using National Instrument’s LabView will already be familiar with the kind of features that µC/Probe brings to the table since providing virtual interfaces is the norm. The big difference is that with LabView the interface is part of the application whereas with µC/Probe the interface is on the other side of the debugger.
I guess a generic Eclipse plugin with µC/Probe-like features will have to be my next project. It would definitely take some of the frustration out of debugging.
In the meantime, I need to get the alpha version of my module up to get some feedback.
About the Author
William Wong Blog
Senior Content Director
Bill's latest articles are listed on this author page, William G. Wong.
Bill Wong covers Digital, Embedded, Systems and Software topics at Electronic Design. He writes a number of columns, including Lab Bench and alt.embedded, plus Bill's Workbench hands-on column. Bill is a Georgia Tech alumni with a B.S in Electrical Engineering and a master's degree in computer science for Rutgers, The State University of New Jersey.
He has written a dozen books and was the first Director of PC Labs at PC Magazine. He has worked in the computer and publication industry for almost 40 years and has been with Electronic Design since 2000. He helps run the Mercer Science and Engineering Fair in Mercer County, NJ.
- Check out more articles by Bill Wong on Electronic Design
- Bill Wong on Facebook
- @AltEmbedded on Twitter


