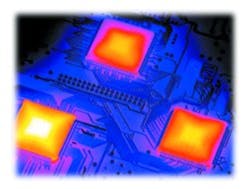
Thermography systems display vital information on those spots, allowing you to correct problems that would shorten the mean time between failures (MTBF). If your new product does have a potentially fatal fever, detecting the hot spots can help you make critical thermal rearrangements before a new design is committed to production.
Methods of Making Heat Pictures
Two techniques are commonly used to collect temperature data on an operating electronic product: infrared (IR) sensing and the use of liquid crystals. Each technique is undergoing constant improvement, and major revisions in display software are making them easier to use.
An IR thermograph can be created for any object with a temperature above 0° Kelvin (-273.16°C) because it radiates IR energy. The emissions level is proportional to the 4th power of the Kelvin temperature.
For example, when a minispot in your product goes from 20°C to 40°C, the IR energy at that location increases by 30%. Closely spaced IR sensing devices stare at those emissions and send their detected energy levels to a computer for compilation of thermal graphs. Sensors don’t contact the circuit being tested so they don’t alter the thermal or electrical characteristics.
Liquid crystal thermography maps the temperature of wafers, chips, and hybrids. The component to be investigated is coated with a very thin layer of transparent liquid crystal. Unlike conventional materials, liquid crystals do not transmute directly from a solid to a liquid state when they are heated, but go through an intermediate liquid (nematic) stage. The temperature at which a given crystal changes its form is very precise, defined by its chemical composition. By monitoring the temperatures where individual spots make this change, a high-resolution heat map can be derived for an operating device.
Liquid crystal thermography is slower but generally less expensive than IR thermography. However, the price gap is narrowing as IR equipment becomes less complex and is built in greater quantities.
IR Thermography
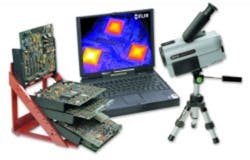
The device that makes modern IR thermography possible is the focal plane array (FPA), an assembly of closely spaced IR sensors. Each sensor looks intently at a microspot on the target and generates an analog output whose amplitude is proportional to the IR radiation from the spot. The outputs are scanned, converted into binary numbers, and sent to a computer for processing and display.
Heat-generating elements in the DUT must be visible to the FPA. A transparent window is used where the product must be enclosed, but that window may be as simple as a piece of Saran Wrap™.
The field of view varies with the application. Using the collimating attachment for a microscopic view, you can examine an area of 1.3² × 1.0² from a distance of 3.5². From a distance of 1², you can inspect an area of 0.4² × 0.3². These translate into spatial resolutions of 40 microns and 12.4 microns, respectively. Each pixel is converted into a 14-bit binary number for transfer to a computer and possible storage on the on-board PCMCIA card.
The SC 3000 Sensor Array, cooled to a very low temperature for greatest efficiency, provides up to 60 frames/s in the RS170 EIA/NTSC format or up to 50 frames/s in the CCIR/PAL format.
Map From an IR Scanner
Binary numbers from the IR scanner are transferred to computer memory at high speed in the typical thermography system. Special thermography software formats pictures and presents them to you in real time with different colors to designate levels of temperature. Sequences of information can be stored on disk. Every image also is stored in 8-bit standard bitmap format with screen graphics if you want them.
The software system in the Therma-CAM uses the National Instruments’ LabVIEW graphical user interface (GUI) to provide a meaningful display and operator-friendly manipulation of the layout. You get a picture of your DUT with a different color for each temperature increment.
“Several enhancements in IR thermography are made possible by the software,” according to Mary Fallon, manager of industrial marketing at FLIR Systems. “These include real-time data storage, temperature-vs.-time plots, image subtraction, classification modeling, and generic reporting.
“Another function of the software,” she related, “involves emissivity correction.” Radiated energy varies directly in proportion to emissivity, a factor that is about 100% for a black body, 50% to 70% for plastic, and less than 30% for metal. This must be compensated in any system that depends on IR radiation for its analysis.
The SC 3000 software corrects automatically for these differences. It uses an IR picture of the unpowered product as a reference and adjusts the readings on a pixel-by-pixel basis for calculated emissivities of 10% to 100%.
Operating on a 12-V power source or from its AC adapter, the 7-lb ThermaCAM can be used in portable applications and placed very close to the DUT for high-resolution analysis.
With some IR systems, a complete frame of data can be collected in a few milliseconds so the thermograph can be used for histograms or high-speed production-line inspection. For example, the SC 3000 drives a video terminal directly. That arrangement is useful in real-time applications but does not offer any post-processing options. Most users are not willing to accept that limitation so a notebook or desktop PC is used in most IR thermography systems.
Liquid Crystal Thermography
Using the liquid crystal thermography technique, you can detect temperature differences of 0.1°C and hot spots as small as one micron. The operating temperature is any specified window between 0°C and 300°C.
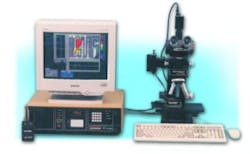
For the Temptronic system, the DUT is coated with a very thin layer of a nematic liquid crystal and viewed by the camera through a microscope equipped with crossed polarizers. Power is applied to the DUT, and the product is allowed to stabilize as if it were in an operating environment. Then the chamber temperature is raised until some spots on the liquid crystal change from clear to dark. Carefully, the temperature is reduced in small increments until every spot on the crystal is clear again and the DUT is ready for a test sequence. The chamber temperature is precisely monitored and stepped through the necessary increments by Thermo-Jogger Software in the system computer.
To detect the location and intensity of hot spots on your product, the temperature of the chamber is raised and allowed to stabilize at equally spaced increments, such as 0.1°C. A picture is taken at each increment. A dark spot appears where the DUT temperature is highest, then expands as the next highest temperature is identified. The system continues incrementing the temperature until every temperature level is discovered.
The sequence of images from the camera is encoded into binary numbers for transfer, display, and storage. Each number represents the temperature of a spot as small as one micron in diameter.
The Liquid Crystal Picture
Pictures representing temperature increments from the liquid crystal detector are transferred to a computer in real time. Temptronic uses the ThermoMap® Software System from Image Therm Engineering to process and display the thermal information. Like the IR scanner, this system uses National Instruments’ IMAQ Vision software and the LabVIEW GUI to process the images.
The system presents a thermal picture of the DUT with each temperature increment represented by a unique color or shade, starting with bright red for the hottest spot and progressing through the rainbow palette. All data is stored on a disk.
Software allows you to use VCR-like controls—play, rewind, fast forward, and pause—to animate the image sequence. The image can be calibrated in units of your choice, such as microns, millimeters, or inches. It can even lay the thermal map over a clean image of the UUT, allowing you to toggle between the two to get a better picture of hot-spot locations.
Since you are likely to find one area of the picture especially revealing, the system software lets you zoom in on a region of interest. Additional processing and analysis can concentrate on this part of the DUT.
What Comes Next?
Looking at recent developments, we can anticipate a continued improvement in thermograph processing and display. Designers will continue to develop new software for data presentation, and we will see faster and more enhanced displays.
Developers are looking for ways to make IR cameras smaller and increase the sensitivity of the detectors. The recent introduction of an FPA that doesn’t need cryogenic cooling gives hope that both of these dreams will come true. Expansion of thermography applications outside the electronic inspection area will feed the continued enhancement of sensor design, and electronic inspection applications can benefit from this.
Return to EE Home Page
Published by EE-Evaluation Engineering
All contents © 2000 Nelson Publishing Inc.
No reprint, distribution, or reuse in any medium is permitted
without the express written consent of the publisher.
August 2000


