Fortunately, this question was presented to the right people at the right time. Now there is a suitable meter for each modulation scheme in general use today. Some of them are relatively simple and traditional while others have complexity comparable to the modulation schemes being analyzed.
A Simple Problem, A Simple Solution
For most simple, continuous-wave (CW) power measurements, a thermal sensor is the tool of choice. This technique was developed a half-century ago to measure and display the heating effect of RF sources.
A thermal sensor generally is a thermocouple covering -30 dBm to +20 dBm with a low output. Alternatively, it may be a thermopile, a series of thermocouples, with the same range but a higher output level.
The thermistor is a thermal sensor, too. It can be used in a Wheatstone bridge circuit for accurate power measurements. However, it has a limited range, typically -20 dBm to +10 dBm, and generally it is used as a thermal transfer standard.
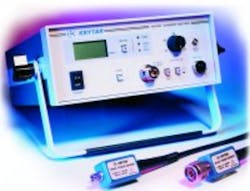
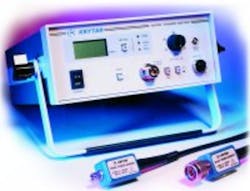
Is the thermal power meter a thing of the past? Certainly not. “Even with all the latest developments,” Hal Crittenden, marketing researcher at Krytar, said, “about 90% of the power measurements still are simple CW. Users need an accurate, low-priced, average-reading meter. They also need an instrument that is useful in the design laboratory, production test area, or the field. This defines a 100-kHz to 40-GHz meter with a thermocouple detector that can be powered from a battery or the AC line.”
A thermal sensor responds to the heating effect of an RF signal. Rapid changes in amplitude are averaged by the inherently long time constant, enabling it to measure the average power of a signal in the range of -30 dBm to +20 dBm.
A simple diode detector can measure average power, too. It generates a voltage that is proportional to the RF signal at lower levels than the thermoelectric sensor. However, it becomes nonlinear above about -30 dBm. Using these two detectors together, you can measure average power from -70 dBm to +20 dBm.
Telecom Signals Require Special Treatment
Modern telecommunications systems are built around complex modulation schemes, and the thermal meter just won’t handle the complex aspects. True, it measures the average power in the complex waveform and does it well. However, in the modern wireless system, phase modulation and amplitude modulation occur together, and the signal may be spread across a broad band. Power must be measured, but this is no simple matter. You don’t want to know the average power level, and that’s all you’ll get with the simple instrument.
There are three basic types of complex signals:
- Time-division multiple access (TDMA) such as the global system for mobile (GSM) communications has precisely timed bursts of modulated information. The modulation is a type of quaternary phase-shift keying (QPSK) with a relatively flat envelope. A meter should measure average power within a burst as well as the power vs. time profile of the leading and trailing edges of the burst.
- The code-division multiple access (CDMA) spread-spectrum technique uses a continuous pseudorandom signal occupying a given portion of the spectrum. This power envelope appears to be noise. The meter should measure average power, peak power, and the peak-to-average ratio (crest factor).
- Multicarrier signals consist of several CDMA or other signals coincident with each other. They can occupy a bandwidth as broad as 5 GHz and impose the ultimate requirement on the meter.
If the pulse shape on the RF carrier is not consistent or if the modulation is complex, as is the case with cellular phones, high-definition TV, satellite and microwave links, and various spread-spectrum applications, special statistical processing techniques must be used. One such measuring instrument uses a diode detector with wide RF bandwidth and narrow video bandwidth, a logarithmic amplifier, a fast sample-and-hold circuit, an analog-to-digital converter (ADC), and a digital signal processor (DSP) with applications software.
By sampling the diode output at a high speed, the statistical meter can measure maximum peak. This is an important parameter since peak values are where adjacent-channel power spillage occurs. Furthermore, the worst-case peak-to-average power can be derived.
Even those parameters are not enough to give a full understanding of the signal power. The statistical meter has the capability to develop the cumulative distribution function (CDF), a statistical analysis of a CDMA or wideband CDMA (W-CDMA) transmission. The graph of this function shows how often the power is at or below the indicated level. Also, the complementary CDF (CCDF) can be used to determine how often the power is at or above the indicated power.
“The capability to capture and display individual time slots is imperative,” noted Vincent Wong, an engineer at Anritsu. “The meter must have frame triggering to measure the average power across a time slot. Marker tables should display the average power between markers or the absolute power level at a marker position for slot analysis.”
You may consider trading dynamic range for bandwidth in a peak sensor. A 5-MHz sensor has a noise floor of about -40 dBm, while a 20-MHz sensor has a limit of -25 dBm.
“The sample rate for statistical analysis needs to be extremely fast so the average power level and maximum peak can be derived,” said Steve Reyes, marketing manager at Giga-tronics. “However, sampling at a fixed rate can increase the effects of aliasing when discrete signals are evaluated. Giga-tronics solved this problem by asynchronous sampling. There is a clock that is dithered between 2.5 MHz and 5 MHz using a Gaussian distribution scheme. This enables the meter to settle to the final reading faster.”
Selecting a Power Meter
Most power meters are terminating instruments. You feed all your RF into the equipment, and it makes your measurement. However, sometimes you need a feed-through measurement. Operation must continue while the meter draws a small amount of power to make a measurement. The Bird meters are best known for in-line use, joined by Tektronix with its NRT product family.
Next, there is a clear delineation between thermal and diode sensor performance, and the latter with peak signal analysis costs more.1 Which do you really need for your application?
Cost is not the only factor. “The speed of response to amplitude changes for a thermal detector is slow,” according to an analysis by Tim Holt, an engineer at Bird, “and for the diode, it is extremely fast. The dynamic range of a thermal sensor is limited, but the diode has a wide range.
“Regarding sensitivity to overload,” he continued, “the thermal unit is easily damaged, partly because the sensor responds to the total power in a waveform. The diode is not as easily damaged by such overloads.”
Another characteristic to consider in the choice of a power meter is the RF spectrum coverage. You’ll find a 110-GHz upper coverage on the Agilent E4416A and Boonton 4531 meters. More typically, you can get 40- or 50-GHz coverage by Anritsu with its ML 2430A, the Giga-tronics 8650A, and the Krytar 9000A.
Other items to consider are video bandwidth and dynamic measurement range. Add the capability to read forward and reverse power, forward or reverse power, or just forward power.
Determine if you need an analog output and a digital interface to your PC and what type of display you want. What is the accuracy for your type modulation, frequency, and power range? Finally, should it be portable, battery-operated, or rack-mountable? If you want to carry it to where the power is generated, a battery-operated, portable unit from Anritsu, Bird, Krytar, or Tektronix may be right for the application.
The ideal power meter for complex wideband signals should combine the accuracy of a thermal meter, the speed of a diode meter, and the display-graphics capability of a peak-reading meter. It would sample at a high rate and have an 80-dB dynamic range with a single sensor. It also would have high sensitivity to handle power as low as -60 dBm and should profile pulsed signals to 0.1-ms resolution. Do you need it? Can you pay for it?
Power-Meter Nostalgia
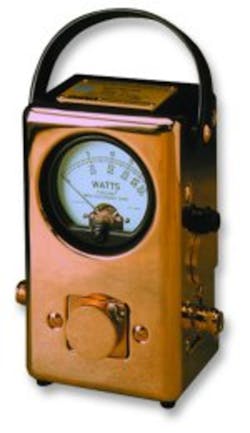
The meter uses a thermal sensor to measure average power and an analog meter for display. Accuracy is ±5% of full scale. This was sufficient for most applications from the 1950s to the 1980s when few complex modulation schemes were in use. Even now, with other average-measuring units on the market, the 43 serves a need. With plug-in elements to determine its power rating and frequency coverage, it measures full-scale ranges of 0.1 W to 10,000 W.
This product was the first of the company’s in-line meters to use the THRULINE technology. Each reading can be either a forward or reverse measurement as determined by the user’s installation of the power element. There is no battery, and no controls are necessary.
The incredible longevity of this 3-lb workhorse is a tribute to its designer, the late J. Raymond Bird. Also, it serves as a reminder that power measurement of straightforward RF carriers is the same today as it was in 1952. It’s those complex modulation schemes that keep power-meter designers busy.
Reference
- Lecklider, T., “The Sharp End of RF Power Measurement,” EE-Evaluation Engineering, February 2001, pp. 26-36.
Return to EE Home Page
Published by EE-Evaluation Engineering
All contents © 2001 Nelson Publishing Inc.
No reprint, distribution, or reuse in any medium is permitted
without the express written consent of the publisher.
May 2001
About the Author
Comment About the Article
To join the conversation, and become an exclusive member of Electronic Design, create an account today!

Leaders relevant to this article: