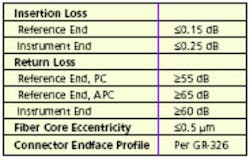
The sole purpose of a connector is to mate fiber-optic cable with minimal loss of light. These connectors are designed for many different applications including telecommunications, local area networks, and harsh environments. Regardless of use, all connectors are optically characterized by insertion loss (IL), return loss (RL), and to some degree, polarization dependent loss.
The most distinct differentiations between connector types are the diameter of the ferrule, 2.5 mm or 1.25 mm, and the type of polish. The physical-contact (PC) polish is a flat finish of the connecting area; the angled physical contact (APC) is at an 8° angle. An APC greatly reduces back reflections caused by the physical interface.Losses Defined
IL is the amount of optical power lost as a result of a connection. Expressed in decibels, it is the ratio of measured optical power before and after the connector (Figure 1). It always is tested because it is the most important connector parameter.
This logarithmic measure allows the simple addition of losses of multiple consecutive connectors. Collective standards affiliations such as TIA, Telcordia (formerly BellCore), and IEC define and provide an acquisition method for all of these test parameters. Affiliation standards applicable to fiber-optic connectors are TIA 6.3.10, FOTP 34, IEC 61300-3-3 Ed.1.0, IEC 61300-3-4 Ed.2.0, and IEC 61300-3-6 Ed.1.0.
In most cases, the RL of a connector is tested together with the IL. Similar to IL, which is a measure of the amount of light transmitted through a connector, RL describes the amount of light reflected by a connector.
In FThe test setup for single-connector characterization is easily realized. For an efficient execution of the qualification test plan for a connector, an automated setup is required (Figure 3).
Depending on the number of connectors to be tested, individual optical sources can be substituted by a single optical source and an optical switch. The repeatability of the optical switch must be in the same order of magnitude as the stability of the light source, typically ±0.05 dB over 24 hours.
If IL and RL are being measured, then the RL meter is the source. To monitor the stability of the source, a reference channel connects the source directly to the power meter. To gather environmental test data, IL and RL vs. temperature, the connector assemblies are mounted in a chamber in which temperature is controlled and monitored by a computer.
Figure 4 illustrates the optical stability of several test specimens over temperature and time. This test starts at 25°C, ramps up to 70°C, dwells for about 15 minutes, and drops to -10°C for about 20 minutes. At the maximum average ramp rate of 5°C/min, one channel is severely affected by the change in temperature. The low-frequency drift of all the channels is caused by the instability of the sources.
Practical Testing Considerations
It is necessary to execute an initial system test and repeat it periodically. This base-line test involves only reference cables and is used to record or minimize the influence of test setup.The causes for irregularities are instability of the light source, drifting of the wavelength of the source, dirty or not properly mated connectors, drift of the power meters, influences of changing polarization, and etalon effects if a narrow linewidth laser source is used. In a multichannel setup, at least one channel should be reserved to monitor the source stability even during qualification testing.
Finally, it is advisable to monitor the ambient temperature during all the tests. A correlation of the recorded temperature with the test results is a quick method to pinpoint temperature dependencies caused by external influences.
Other common pitfalls include the following: • Cleanliness—Any speck of dirt within the connection can cause fluctuations of IL or RL over time, resulting in variations based on temperature changes. • Routing—Fibers should be neatly routed and secured with tape or Velcro® strips to minimize movements caused by air-conditioning fans, pedestrian traffic, and other vibrations. A stressed or bent fiber relaxes over time and changes the IL of the cables, specifically with longer wavelengths such as 1,550 nm or 1,625 nm.
While setting up the qualification test, each connector has to be thoroughly cleaned and inspected, preferably with a 200× microscope. A speck of dirt can damage both contacts on the very first mating of the connector. Inspection will greatly reduce the risk of this happening.
Trends in Fiber-Optic Connectors
With the ever-increasing demand for rack space in central offices, network cabinets, and server farms, bulky fiber-optic patch panels no longer are practical. Small formfactor connectors with 1.25-mm dia ferrules and housings that allow for compact arrangement of the bulkhead soon will replace the still dominant 2.5-mm dia ferrule-based connectors such as ST, PC, and SC.
Changing With the Times
As ongoing research continues to produce connectors that yield a higher fiber count per square inch and are easier to install in the field and less susceptible to dirt and damage during use, test and evaluation engineers will refine test methods and processes. Only rigorous testing and diligent certification based on evolving industry standards will result in the quality of connectors required to meet the ever-increasing demand for bandwidth.
About the Author
Richard Buerli is the vice president of new product development at Tempo Research. He holds a master’s degree in computer science from the Swiss Federal Institute of Technology, Zurich, and has been active in the fiber-optics test and measurement industry since 1985. Tempo Research, a Textron Company, 1340 Flynn Rd., Camarillo, CA 93012, 805-389-9800, e-mail: [email protected]
For More Information For more information on this topic, visit our website at www.evaluationengineering.com and access the Article Archives.
March 2002


