So began a recent announcement of the new surge protection service being offered by an affiliate of Florida Power & Light. The main offices of Evaluation Engineering are located in Florida, and the information was included with the monthly electricity bills.
“If your home isn’t properly protected from [lightning surges], they can damage your major appliances and electronics,” the announcement continued. “FPL Energy Services will come to your home and install a heavy-duty surge protector to your electric meter…serving as the first line of protection to your electronics….”
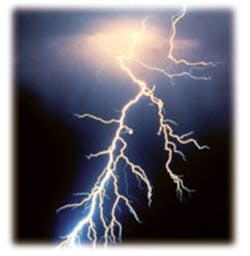
Lightning occurs almost everywhere on earth but in greatly differing amounts. For example, there are very few thunderstorms in the Arctic and Antarctic.
“Oceanic areas also experience [a dearth of lightning],” according to Hugh Christian, project leader for the National Space Science and Technology Center’s lightning team at NASA’s Marshall Space Flight Center. “The ocean surface doesn’t warm up as much as land does during the day because of the water’s heat capacity. Heating of low-lying air is crucial for storm formations.”1
Florida’s east- and west-coast sea breezes together with enough land mass to provide the needed high temperatures generate frequent storms for much of the year. Similar high lightning activity is found in the Himalayas due to the convergence of air masses from the Indian Ocean and in central Africa.
The average peak power per lightning stroke is 1012 W. With a duration of about 30 µs, a single stroke can transfer 30 MJ of energy. And, what appears to be a single lightning flash often consists of four or more strokes in quick succession. It’s not surprising that such a sudden and large electrical event should cause disruption to nearby power distribution circuits.2
Surge testing replicates the effect of this disturbance to prove that AC-powered equipment will survive an actual strike. For this purpose, two standard types of waveforms have been defined by IEC 61000-4-5.
Figure 1a. Combination Wave Open-Circuit Voltage
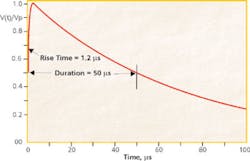
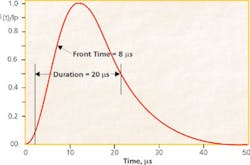
The first, the combination wave, is a single pulse with two specifications. When driving an open circuit, the voltage pulse from a combination wave generator exhibits a 1.2-µs rise time to its peak followed by a slowly decaying tail that reaches 50% amplitude after 50 µs (Figure 1a, see above). When connected to a short circuit, the same generator output reaches its peak current level in 8 µs and decays to 50% amplitude after 20 µs (Figure 1b, see below). In the literature, this is sometimes referred to as a 1.2/50-8/20 surge.
Figure 1B. Combination Wave Short-Circuit Current
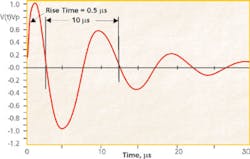
The second waveform is the ring wave shown in Figure 1c, see below, a damped 100-kHz oscillation following a fast leading edge. The waveform has a 0.5-µs voltage rise time into an open circuit or a 1.0-µs current rise time into a short circuit. In either case, the amplitude of successive peaks is specified to be 60% of the previous peak. In practice, this means that the oscillations effectively have stopped after four or five cycles.
Figure 1c. 100-kHz Ring Waveform
In contrast to the combination wave that has a 2-W output impedance, the ring wave is used with 12, 30, or 200 W depending on the type of circuitry being tested. Lower impedances are intended to be used when applying the pulse to power or communications ports fitted with surge-protection devices (SPDs). The higher 200-W output impedance should be used with communications ports that are not surge protected.
Waveform-Related Effects3
Radiotechnical Commission for Aeronautics (RTCA) DO-160D, ANSI C62.41, ISO 7637, and a number of commercial standards specify waveforms similar to the combination wave of IEC 61000-4-5. These waveforms are either defined or can be closely approximated as a double-exponential form shown in the following equation:
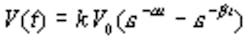
where: b controls the rise time
a controls the fall time
A general expression for the frequency spectrum of these waveforms was found by applying the Fourier transform. Analysis results have been presented as a series of Bode plots as shown in Figure 2, see below. To a first approximation, voltage per Hertz is constant for low frequencies up to the first breakpoint of a radians/s (a/2p Hz). The plots follow a -20 dB/decade line to the second breakpoint of b radians/s (b/2p Hz) and -40-dB/decade after that.
Figure 2. Multiple Surge Waveform Bode Plot
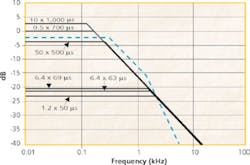
For several waveforms with the same peak voltage but different rise and fall specifications, the first breakpoints in the Bode plot lie on the same -20-dB/decade line. The only requirement is that the rise time be at least seven times faster than the fall time.
One conclusion can be drawn from this relationship: only a few test pulses need to be used, such as a high-energy 10-µs/700-µs pulse, a 6.4-µs/70-µs medium energy one, and a fast low-energy pulse of 1 ns/100 ns.
Further examination of the analysis results showed that about 50% of the energy is contained below the first breakpoint. This means that the 100-µJ energy level commonly associated with semiconductor device burnout may be reached at a very low frequency. For a 1-kV peak amplitude high-energy pulse such as the ANSI C62.41 10-µs/1,000-µs pulse used for telecom testing, 100 µJ is provided by frequencies below 0.005 Hz. Even for the commonly used 1-kV 1.2-µs/ 50-µs voltage pulse, frequencies below 1.4 Hz contribute 100 µJ of energy. This analysis assumes a 42-W generator output impedance and a 92-W test load to simulate a typical data line.
These frequencies are too low to be economically filtered. Instead, the energy must be controlled through voltage clamping. The problem may be overstated in this analysis because very low frequencies from real lightning usually can’t couple efficiently to the circuit of interest. For example, very little 1.4-Hz energy is transferred by a 60-Hz transformer. Nevertheless, a 1-kV 10-µs/1,000-µs pulse with a 42-W output impedance can deliver 3.7 J to a 92-W test load, so without suitable precautions, the DUT circuitry easily could be damaged.
Potentially damaging amounts of energy also are associated with higher frequencies. For example, with the same output and load impedance values, 100 µJ of energy is provided by those frequency components above 465 kHz for a 1-kV 1.2-µs/50-µs pulse. For that reason, lightning protection requires separate approaches to low and high frequencies.
Test Anomalies
With only a few basic waveforms and a clearly defined purpose, you might assume that surge testing would be straightforward. In most cases, no doubt it is, but anomalies do exist to catch the unwary. For example, the peak voltages encountered during on-site testing were found to be decreasing from as early as 1995. This fact was interpreted by some designers as meaning that smaller transient suppression devices could be used in new equipment.4
In fact, peak voltages were decreasing for two reasons. To avoid the damage caused by high surge voltages, manufacturers and installers were fitting SPDs in large quantities. Also, as PCs and similar electronic equipment proliferated, an increasing number of switch-mode power supplies (SMPSs) were connected to power distribution systems. This placed a very large distributed capacitance from line to neutral.
Loading by SPDs and capacitors reduced the surge voltage but not necessarily the current. A lower measured surge voltage told only half the story. Because of the large current surge, sufficient energy still was available to cause significant damage.
In a separate incident, while investigating the PCs-galore effect, the result of adding many PCs or equivalent electronic equipment and their associated SMPS capacitors to the power system, the authors of reference 4 encountered another problem. Their surge generator oscillated when loaded by many SMPS capacitors. This behavior limited the measurements that could be made, so a computer simulation was used instead.
Surge generators develop high-level pulse voltages and currents by storing energy in an L-C circuit. This approach works well for most purposes, but real surges don’t come from an L-C network.
Recent IEEE/ANSI Standard Changes
Lightning hasn’t changed, but our understanding of it and the surges it produces in power distribution systems certainly has. To reflect this new knowledge and improve the usefulness of IEEE/ANSI C62.41 and IEEE C62.45, these documents have been revised and simultaneously reissued as a so-called trilogy.
These standards are separate from IEC 61000-4-5 but written with the benefit of liaison among the relevant working groups in the IEC and IEEE organizations. In particular, the basic test waveforms adopted by both groups have not changed.
IEEE/ANSI C62.41 has been split into C62.41.1-2002 Guide on the Surge Environment in Low-Voltage AC Power Circuits and C62.41.2-2002 Recommended Practice on Characterization of Surges in Low-Voltage AC Power Circuits. The first of these now includes an expanded database with recordings of surge events in the field, numerical simulations and laboratory research, inferences on the surge environment drawn from analysis of equipment field failures, and a discussion of the data base.
The demarcations between different location categories have been redefined as transitions rather than boundaries. The concept of location categories correctly assumes that increased inductance will reduce the current stress on an SPD as its distance from the electrical service entrance increases. However, the previous idea of boundaries was sometimes taken too literally. Substituting transitions for boundaries is intended to give manufacturers and users more flexibility in determining appropriate surge-withstand values.
In addition, the treatment of the surge environment has been expanded. Previously, all surges were assumed to enter the building via the service entrance or to have been internally generated. The unlikely but possible scenario of a direct lightning hit on the building now has been included.
The second standard updates information and retains the recommended practice status of the 1991 C62.41 document before it was split into two parts. In IEEE parlance, a guide presents information with no attempt to steer the reader in a certain direction. In contrast, a recommended practice lists possible choices, but the first choice is the one recommended.
IEEE C62.45 has been upgraded to a recommend practice: C62.45-2002 Recommended Practice on Surge Testing for Equipment Connected to Low-Voltage AC Power Circuits. The standard’s contents have been updated to address the prevailing use of digital instruments, for example, and the associated effects of aliasing and insufficient resolution. Precautions for avoiding artifacts are included.5
Conclusion
The adoption of the trilogy is an important step in surge-testing unification. However, worldwide, surge testing is governed by many organizations. Standards will continue to change as will special DUT conditions and requirements.
As has occurred in other types of instruments, surge generators are benefiting from the availability of better test software. Customized pulse patterns developed for particular test-lab customers and DUTs can be stored and repeated as required. Test setups are recorded, and remote generator operation is facilitated. The last point directly promotes operator safety, especially when some tests call for peak currents of 100 kA and peak voltages of 100 kV.
References
- “Where Lightning Strikes,” science.nasa.gov/headlines/y2001/asto05dec_1.htm?list69136
- “Lightning Detection From Space: A Lightning Primer,” thunder.msfc.nasa.gov/primer/primer2.html
- McConnell, R., “Amplitude and Energy Spectra of Transient Test Waveforms,” Symposium Record of the 2001 IEEE EMC International Symposium, Vol. 1, pp. 243-248.
- Martzloff, F., et al, “The Fallacy of Monitoring Surge Voltages: SPDs and PCs Galore!,” Proceedings PQA 1999 Conference.
- Martzloff, F., “The Trilogy Update of IEEE C62.41,” Proceedings of the 25th International Conference on Lightning Protection, 2000, pp. 887-892.
FOR MORE INFORMATION
conducted EMC test system
www.rsleads.com/309ee-238
transient test generators
www.rsleads.com/309ee-239
surge test systems
www.rsleads.com/309ee-240
surge testing per IEC 61000-4-5
www.rsleads.com/309ee-241
EMC test equipment
www.rsleads.com/309ee-242
Return to EE Home Page
Published by EE-Evaluation Engineering
All contents © 2003 Nelson Publishing Inc.
No reprint, distribution, or reuse in any medium is permitted
without the express written consent of the publisher.
September 2003
About the Author
Comment About the Article
To join the conversation, and become an exclusive member of Electronic Design, create an account today!

Leaders relevant to this article: