Spectrally uniform noise is the ticket to accurate and repeatable filter testing if you know a few simple tricks.
Often a mixed-signal test engineer is asked to test a filter, sometimes a discrete unit, but more commonly a filter embedded in a more complex mixed-signal device. To properly perform the task, he needs a thorough understanding of the various test techniques and the advantages and disadvantages of the most commonly used methods.
Testing filters requires a foray into Fourier; that is, the only proper way to test the amplitude response of a filter is in the frequency domain. Generally, there are two things you should know about the amplitude response of any particular filter: the frequency at which the 3-dB (half power) point occurs and how much the filter attenuates a particular frequency.
Testing Techniques
Each of the various techniques used to test filters relies on sourcing a waveform into the filter and capturing the output using standard, coherent testing techniques with minor modifications.
Single-Tone Sine Wave Testing
Drive a sine wave into the filter, digitize the output, and perform a fast Fourier transform (FFT). Search for the knee (3-dB point) by sweeping the frequency of the sine wave.
- Advantages: unambiguous, simple, and easy to understand.
- Disadvantages: slow. While a spectrum analyzer has dedicated hardware to sweep a sine wave through a range of frequencies, the typical mixed-signal test system uses an arbitrary waveform generator (Arb). Arbs have no mechanism for sweeping the output frequency. Changing the frequency of the output waveform requires reprogramming the clock frequency or reloading the Arb memory with a new waveform, both of which take time.
Multiple-Tone Sine Wave Testing
Drive a multitone sine wave into the filter, digitize the output, and perform an FFT. The filter response will be apparent by the attenuation of the spectral bins of each of the tones sourced.
- Advantages: relatively simple and easy to understand.
- Disadvantages: low resolution unless many tones are used. Randomized phases are required to decrease the peak to rms ratio (crest factor). If you don't use some technique to adjust the phases of the tones, you end up with impulse testing.
Impulse Testing
Drive a single impulse into the filter, digitize the output, and perform an FFT. Because an impulse contains all frequencies, the filter response will be apparent by the shape of the magnitude portion of the spectrum.
- Advantages: simple, high resolution, and fast.
- Disadvantages: high crest factor and not intuitively obvious.
Impulse testing would be a great way to test a filter except for one major problem. The signal-to-noise ratio of the impulse is too low because the impulse must be infinitely narrow to keep the spectrum flat.
In a discrete time (sampled) test system, the impulse will be one sample wide, but that seriously limits its energy, and exposure to noise will degrade the test results. Any attempt to widen the impulse to increase the signal-to-noise ratio changes the shape of the spectrum. This makes the impulse method unsuitable in real test environments.
White Noise Testing
Drive a periodic white noise waveform into the filter, digitize the output, and perform an FFT. Because periodic white noise contains all frequencies from DC to Nyquist, the filter response will be apparent by the shape of the magnitude portion of the spectrum.
- Advantages: low crest factor, simple, high resolution, and fast. It has the lowest cost in terms of test time.
- Disadvantages: based on a pseudorandom number generator, so this approach sometimes is misunderstood as producing random results.
Using Noise to Solve a Noise Problem
Like an impulse, periodic white noise also has a perfectly flat spectrum. But because the phases of the individual frequencies are randomized using a pseudorandom sequence, the energy level is high relative to the peak voltage.
An impulse really is just a sum of all frequencies with the phases aligned. Randomize the phases, and the impulse disappears. What looks like noise appears. As the crest factor goes down, the peak excursion of the signal decreases, and the average signal level can come up to a respectable level.
Periodic white noise is a little different from regular white noise. Being periodic within one unit test period, it is fully coherent, which makes the spectrum totally flat in a discrete time system.
To generate periodic white noise, you can use an interactive tool such as Nextest's Mixed-Signal Wave Tool to create and manipulate waveforms as you would variables in a calculator. Start by creating a frequency-domain waveform of N/2+1 identical samples consisting of a DC level of 1 V. Next, make sure to zero the last sample in the waveform.
Then use a pseudorandom number generator or generate a white noise waveform to create the phase waveform, again with N/2+1 samples between -Pi and Pi. Join the two waveforms into a polar waveform, convert to a rectangular form, and then convert to the time domain with an inverse FFT. This will generate N samples in the noise-like test waveform.
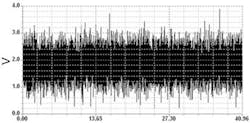
After rescaling to fit within the range of the Arb and capturing with the analog capture instrument (ACI) in the Nextest Lightning System, the waveform will look something like Figure 1.
Notice the density. This is a high-energy waveform when compared to an impulse. That energy will help us raise the signal-to-noise ratio to reduce the effects of the noise that we can t do anything about. It may sound strange calling a noise waveform a signal, but let's take a look at the captured waveform's spectrum.
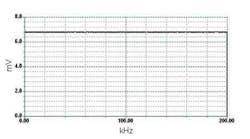
As shown in Figure 2, the spectrum is very flat. Periodic white noise is inherently spectrally flat. There is a small amount of noise in the spectrum, which is not inherent in the waveform.
The additional noise was captured from the environment after the signal passed from the Arb, through the load board, and back into the ACI. It's the same noise that causes problems with the impulse technique, but because there is more signal amplitude, it should not affect the results as much.
Now that we have a spectrally flat signal, we can pass it through the filter to see how it affects the signal.
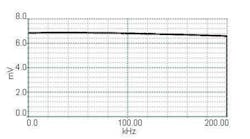
The filter under test in Figure 3 obviously is a low-pass filter, and the shape is textbook perfect. The cursors have been placed at the maximum value and the expected filter cutoff frequency of 150 kHz. The difference in amplitude between the two is 2.997 dB.
In our test program, all we need to do now is search this magnitude waveform from DC toward Nyquist for the 3-dB point. Once we find it, we datalog the frequency, and the filter test is done.
There is a small amount of noise on the spectrum. This noise is captured from the environment and has been reduced to the minimum value possible. This small amount of noise will cause our results to vary a little but far less than they would if we had used an impulse rather than periodic white noise as the stimulus.
Calibration Through Reciprocation
To ensure a perfectly flat spectrum for the DUT, run the signal through the instruments but bypass the filter using a relay or an alternate path such as an unused matrix pin. The periodic white noise waveform is captured, and an FFT is performed. Then the magnitude portion is extracted, and reciprocation is performed.
By taking the reciprocal of the magnitude, any droops in the spectrum caused by inherent filtering will be compensated for by moving the magnitude in the opposite direction. The inverted magnitude waveform then is rejoined with the phase portion of the spectrum, and an inverse FFT is performed.
What results is a frequency-compensated, time-domain waveform that can be loaded into the Arb and sourced to the DUT. Any droops or roll-off in the resulting spectrum are virtually guaranteed to be caused by the DUT and not any portion of the test system or load board.
Let's look at how this works. First we have the pre-cal spectrum.
Figure 4a is the magnitude plot of the spectrum we captured without the filter but prior to calibration. There is a little droop in the upper portion of the band, due mostly to sin (x)/x roll-off. Taking the reciprocal of the magnitude waveform produces a waveform that, when presented to the DUT, is perfectly flat. Then any nonflatness is due to the filter.
Notice the magnitude of the values in the spectrum: they are more than 100 V (Figure 4b). Since this is the reciprocal of very small values, we will have to rescale the time-domain waveform to keep it in the range of the Arb.
After inverting the magnitude waveform, set the Nyquist bin magnitude to zero, or we might find a very large signal at exactly FS/2. That wouldn t be a huge problem, but any large signal that we don't need could cause a decrease in the overall energy of the waveform when we rescale the time-domain waveform to be compatible with the Arb.
Smoothing the Rough Edges
If the Arb and the ACI run at the same sample frequency, the ACI could capture the noise waveform on the edges on one run and on the flat spots during other runs. This can cause too much variation in the captured waveform to make this technique useful. There are, however, several solutions to this problem.
One solution applies a filter to the Arb that is somewhere between Nyquist and FS. The filter smoothes the edges so there will be less variation in the results. The calibration will compensate by emphasizing the edge rates, so it does have a negating effect.
Re-Sampling
If you have the spectral headroom, there is another technique that can be used. If the white noise waveform is re-sampled to a higher sample rate, then the edges are smoothed without filtering, and the ACI results will not vary as much with changes of phasing between the two instruments. Re-sampling preserves the spectral content of the white noise waveform while increasing the sample rate.
You can t just crank up the sample rate of the Arb. That would increase the frequency of the components sent to the ACI, and they would likely alias. Imagine what that could do to your filter measurements.
We showed you the pre-emphasized (reciprocated) spectrum. Now we will resample it by a factor of eight. This changes both the number of samples and the sampling frequency by a factor of eight. Figure 5 shows the oversampled and calibrated white noise spectrum.
The frequency band goes all the way up to 1.6 MHz, but the only place there is any signal is from DC to 200 kHz. When we capture this waveform with the ACI at a 400-kHz sample rate, there will be no aliasing because there are no frequency components above the Nyquist frequency of the ACI.
In these examples, we used an oversampling ratio of eight that results in filter cutoff frequency values that vary by about 0.4% depending on the actual noise in the system. An oversampling ratio of 16 results in values that vary by about 0.32% so not much is gained by oversampling by a huge ratio.
Using an oversampling ratio that is not a power of two has an unpleasant side effect: It takes a long time to resample the periodic white noise waveform. But since that's only done once in the “before_testing” block, it does not affect test time, only program load time. Using a ratio below eight is not recommended because the results tend to vary in whole percentage values, quickly degrading to 10% or more below an oversampling ratio of four.
Conclusion
Filter testing can be done in several ways. An old favorite, impulse testing, can be compromised by a low signal-to-noise ratio because of the low energy contained in the impulse. It seems counterintuitive to fight a signal-to-noise ratio problem with noise, but spectrally uniform noise really is the ticket to accurate and repeatable filter testing if you know a few simple tricks.
About the Authors
Dan P. Bullard is a marketing applications engineer for Mixed-Signal Products at Nextest Systems. He also has worked at GenRad, Credence Systems, and Schlumberger and began specializing in mixed-signal test in 1990. In addition, Mr. Bullard has trained students in all aspects of U.S. Navy communications systems, basic electronics, and digital and mixed-signal test systems throughout the world. Nextest Systems, Mixed-Signal Technology Center, 10200 SW Nimbus Ave., Suite G4, Portland, OR 97223, 503-670-9985, e-mail: [email protected]
David Reynolds is the director of software at ProTest. He has 30 years of experience in the software industry and previously was a principal software engineer at Credence Systems. ProTest, 72 Main St., Meredith, NH 03252, 603-279-3463, e-mail: [email protected]


