Life Testing and Reliability Predictions for Electromechanical Relays
An industry expert discusses use of the Weibull distribution for life testing electromechanical relays.
Life tests for electro-mechanical relays can be set up using relatively small sample sizes, typically less than 30 relays. To achieve predictions of expected life with reasonably high confidence, one method uses the two-parameter Weibull distribution of beta (b) and eta (h).
Life tests using 30 or fewer relays generally are run to several hundred million operations. Since relays only age when actually switched, increasing the switching frequency can easily accelerate aging.
Typically, dry-reed relays are specified for several hundred million operations over a period of several years. The life period usually can be accelerated to several weeks by running the devices in the range of 25 Hz to 200 Hz. Most relays used in ATE and communications hardware have operate and release times of <1 ms, allowing them to operate easily at these frequencies.The life test monitors every operation on each relay with a miss limit typically set for 1 W and a stick limit for 0.5 V. The load must be defined and should be based on the requirements of the application. For example, if the relay will switch a 10-V/5-mA resistive load in the application, then the life test should duplicate this condition.
Depending on the application, life tests also can be set up with capacitive and inductive loads. Both capacitive and inductive loads can have high peak currents and require compensation to prevent shortened relay life.
Using Weibull to Establish Sample Size
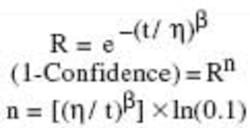
Assuming that the underlying distribution is Weibull, the minimum sample size can be determined for a life test. The number of units required for a zero-failure substantiation plan can be derived from the Weibull reliability equation and the relationship of reliability to the confidence level. The total number of test units required for a 90% confidence level is calculated as follows:
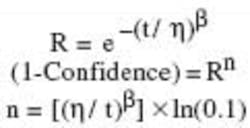
| where: | R | = | reliability |
| t | = | total number of test cycles | |
| h | = | number of cycles where 63.2% of the population has failed (characteristic life) | |
| n | = | sample size | |
| b | = | slope parameter |
Table 1 is constructed based on this equation. For a t/h ratio between 0.01 and 0.80, the sample size generally is <30. High confidence can be obtained for total run cycles within 1% to 80% of h. For dry-reed relays, h typically is in the range of 500 million (M) cycles.
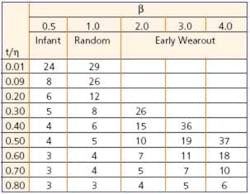
Table 1. Sample Size vs. t/h
As a result, the bounds for the life test would be between 5M and 400M cycles. The maximum number of operations required depends on b, with higher run times required to verify populations with high b. Running to 200M to 300M operations is sufficient to generate failures and provides good statistical data for most dry-reed relays.
Using Weibull For Life Predictions
The results from several life tests were examined to demonstrate the effectiveness of the Weibull distribution for these applications. Two dry-reed relays were compared in the first study. The first device was a single-pole single-throw (SPST) relay and the second a four-pole single-throw (FPST) relay.
Both life tests were set up with identical loads of 5 V/20 mA. A sample size of 28 devices was run to 300M cycles for the SPST test, and five devices were run to 100M cycles for the FPST test.
The results are plotted on the Weibull chart in Figure 1. b = 1 for both devices, which implies that these populations are in the steady-state failure portion of their life cycle since failures are random and independent of time. The h is 2,300M cycles for the SPST device and 65M cycles for the FPST device.
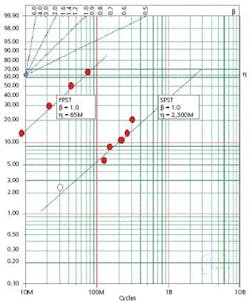
Figure 1. Weibull Plot of SPST + FPST Relays
The t/h ratio is >1 for the FPST device and >0.13 for the SPST device. Table 1 shows that the sample size of five for the FPST part and a sample size of 28 for the SPST part were more than sufficient to verify the reliability of these parts with good confidence.
A second study was made with two SPST dry-reed relays running a 10-V/4-mA life test, and the results are plotted in Figure 2. The sample size for both tests was 28. The life test for sample A was run to 100M cycles and 200M cycles for sample B. The results for sample A show infant failures with b = 0.67 while the results for sample B indicate some degree of wearout with b = 1.5.
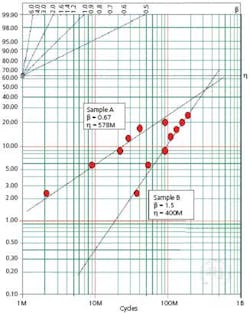
Figure 2. Weibull Plot for Two SPST Relays
The h for sample A is 578M cycles and 400M cycles for sample B. The t/h ratio for sample A is 0.35 and 0.5 for sample B. From Table 1, the minimum sample size is five units for sample A and seven units for sample B. The selected sample size of 28 was more than sufficient to verify the reliability of these parts.
Electromechanical Relays vs. HDDs
Figure 3 shows a typical Weibull plot for a hard disk drive (HDD). The annual failure rate (AFR) is the failure percentage at the one-year point or 8,760 hours of operation.
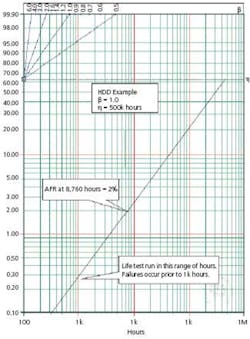
Interesting comparisons can be made between the life tests for HDDs and relays. HDDs have characteristic lives of 100k to 500k hours. Life tests for HDDs typically are run to 1,000 hours, which result in a t/h = 0.002. Assuming b = 1, the sample size required to achieve a 90% confidence level is calculated as follow:
n = (500k/1,000) � ln(0.1) = 1,150
Large sample sizes are required for HDDs since the ratio of test time to the h is very small.
A typical HDD life test is set up with 1,000 drives running for 1,000 hours or about six weeks. The Weibull prediction is based on establishing the b with very low hours per device.
Since failures occur at a time less than 1,000 hours, the slope of the Weibull plot line for HDDs is determined by a few points at the lower left corner of the plot. This means that small changes in the failure points can have huge effects on the predicted value for the h.
Life tests for relays can be run much closer to their total expected life, resulting in better predictions for h. Also, since high cycle counts can be achieved in the life test, the ratio of test cycles to the expected life is closer to one, reducing the need for huge sample sizes.
Conclusion
The two-parameter Weibull distribution is well suited for predicting the life of electromechanical relays. The tests can be set up with relatively small sample sizes and the results plotted with low numbers of failures. By accelerating the operating frequency of the relay, the total number of test cycles can be close to the h for the part, reducing the required sample size.
Weibull plots can easily be generated using commercially available software such as Weibull++ from ReliaSoft. However, assuming the data is reasonably well behaved, the plots also can be performed by hand. Either way, it provides an excellent statistical analysis of the test results. The use of the Weibull distribution is a very simple and effective tool for predicting the life of electromechanical relays.
About the Author
Phil Roettjer is president of Relay Testing Services and has more than 20 years of experience in the development of hard disk drives. Before joining RTS, he was the director of quality for the high-end disk-drive division at Maxtor. Relay Testing Services, 89 Hartford Ave. East, Mendon, MA 01756, 508-473-5005, e-mail: [email protected]
June 2004
About the Author
Comment About the Article
To join the conversation, and become an exclusive member of Electronic Design, create an account today!

Leaders relevant to this article: