Directional Power Measurements And the Effects of Directivity
Knowing the directivity specification of your measurement device can go a long way in setting measurement expectations.
Directional power measurements are important when determining transmitter output power, transmission-system voltage standing wave ratio (VSWR), and return loss. The directivity of the coupler that forms the heart of a directional power meter is critical to the accuracy of these measurements. Errors due to directivity can be significant and may influence the decisions you make based upon your test results.
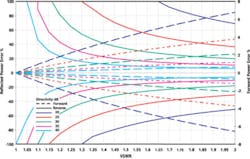
Figure 1 illustrates the effects of directivity. An in-line power meter or antenna monitor with 25 dB of directivity will produce measurements with a wide margin of error when compared with those of a 40-dB device: for a VSWR of 1.5, approximately 2% vs. 0.4% forward power error and 50% vs. 10% reverse power error. This could make the difference between judging your antenna to be in or out of specification. This also may cause false-alarm conditions when monitoring your antenna.

Directional Coupler
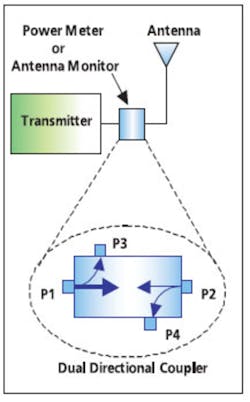
A passive directional coupler measures forward and reflected power and facilitates determination of VSWR and return loss. For that reason, it often is the key component in power meters, antenna monitors, and analyzers. It provides samples of the transmission line electric and magnetic fields. Summing the two samples corresponds to the forward orientation while subtracting them relates to the reflected orientation.
As shown in Figure 2, directional couplers have a pair of forward and reflected main ports and associated coupled forward and reflected output ports. Power input to the main forward port P1 will produce a power sample at the coupled forward port P3. This forward power sample is proportional to the main input power. A reflected power sample also will be produced at the coupled reflected port P4 when power is presented at the main reflected port P2.
The basic formulas required to calculate coupled power include the following:
Coupled Power = Main Power/Coupling Power Ratio
where Power Ratio = 10(dB/10)
As an example, a 100-W main power input to a directional coupler with a coupling factor of 30 dB will produce the following:
Coupled Power = 100 W/10(30 dB/10) = 100 mW
As a result, 100-W input to the main forward port P1 will produce a 100-mW output at the coupled forward port P3. At the same time, 4 W reflected into the main reflected port P2 will generate a 4-mW sample at the coupled reflected port P4. These figures assume that the coupled reflected port P4 is perfectly isolated from the main forward port P1. Also, the coupled forward port P3 is ideally isolated from the main reflected port P2.
Directivity
In practice, there is finite isolation between these ports. The difference between this isolation value and the coupling factor defines the coupler�s directivity, a measure of how well a directional coupler distinguishes between the forward and reflected traveling wave in the transmission system. Directivity is optimized by balancing the contributions from the electric and magnetic field components.
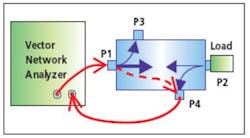
Figure 3 illustrates the test setup used to determine isolation. A good load is connected to the main reflected port P2. The main forward port P1 is driven and the output at the coupled reflected port P4 measured. The coupler then is reversed to test the coupling factor. The load is connected to the main forward port P1. The main reflected port P2 is driven while the output of the coupled reflected port P4 is measured.
The coupling factor from P2 to P4 is the same as the coupling factor from P1 to P3. Also, isolation from P1 to P4 is equal to the isolation from P2 to P3. A vector network analyzer may be used to determine directivity by measuring the isolation and coupling factor.
Directivity (dB) = Isolation (dB) – Coupling (dB)
Directivity Errors
Because of the coupler�s limited isolation, power input to P1 will produce power at P4. This portion of forward power unintentionally leaking into P4 is equivalent to the main input power reduced by the isolation value. Similarly, power will be produced at P3 when power is presented at P2. Finite isolation is the root cause for directivity errors.
The outputs from each of the coupled ports have two components corresponding to the two main ports. P4 produces outputs caused by the reflected power at P2 less coupling and the forward power at P1 less isolation. The output at P3 is proportional to forward power at P1 less coupling and reflected power at P2 less isolation.
The values that would be measured by a power meter can be expressed as a series of relationships:
Measured Reflected Power = Main Reflected Power + Directivity Reflected Power Measured Forward Power =
Main Forward Power + Directivity Forward Power
Combining the main reflected power with the directivity reflected power cannot be done by simple addition, but rather the powers must be converted to voltages that are combined using vector math. This results in minimum and maximum voltage levels that then are converted back to minimum and maximum powers that define the directivity error range. The same process is followed to combine the main forward power with the directivity forward power.
Because the phases of the voltage vectors are unknown, the extreme cases of combining in or out of phase must be assumed. The minimum and maximum voltages are converted back to power values that then are used to calculate minimum and maximum values of VSWR and return loss.
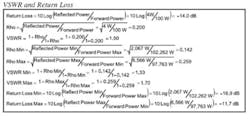
VSWR and Return Loss
VSWR and return loss both are complex ratios of forward and reflected power. Rho, also a ratio of these powers, often is used as an interim step in computing VSWR.
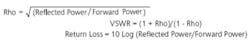
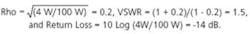
Reflected power is related to VSWR and forward power by:
Reflected Power = Forward Power [(VSWR -1)/(VSWR + 1)]2
= Forward Power � 10(Return Loss dB/10)
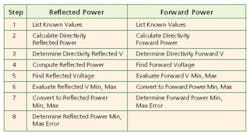
The steps required to determine forward and reflected power and the order in which they are performed are presented in Table 1.
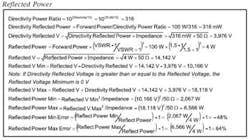
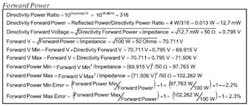
As an example, determine the forward and reverse power errors caused by using a power meter with 25-dB directivity to measure the performance of a 100-W transmitter connected to a 50-? antenna specified with a 1.5 VSWR (-14 dB return loss).
From Figure 1 and the detailed example, some trends are apparent:
-
As directivity increases from 20 to 40 dB, errors decrease.
-
Directivity has a great impact on reflected power measurement error percentages. Forward power measurement error percentages are less affected.
-
Errors due to directivity vary for antennas and other loads with different levels of VSWR or return loss.
-
Directivity errors are independent of power levels.
Knowing the directivity specification of your measurement device can go a long way in setting measurement expectations. To optimize accuracy, look for test and monitoring equipment with the highest level of directivity available.
About the Author
Jim Norton is an applications engineer at Bird Electronic. He has 20 years experience in the land mobile radio and cellular telephone industries, serving in both applications and systems engineering roles. Most recently, Mr. Norton has been involved in developing portable instruments for analyzing antenna and transmission systems. Bird Technologies Group, 29100 Aurora Rd., Solon, OH 44139, e-mail: [email protected]
FOR MORE INFORMATION
about computing power, directivity, VSWR, and return loss
www.rsleads.com/503ee-176
March 2005
About the Author
Comment About the Article
To join the conversation, and become an exclusive member of Electronic Design, create an account today!

Leaders relevant to this article: