A single-parameter modulated RF power measurement is just so 20th century.
The first step in making accurate RF power measurements is choosing the sensor most appropriate for the signal. Obviously, you wouldn�t use a sensor limited to 1 mW (0 dBm) for a 1-W (30-dBm) signal. Nor can you use a thermal sensor to measure the peak power of a fast pulse. And, a simple diode sensor calibrated to read the correct power level of CW signals can�t be used for digitally modulated signals above about -20 dBm.
In addition, RF power measurement is subject to several sources of uncertainty. These include instrumentation accuracy, noise, zero set and drift, reference power uncertainty, reference-to-sensor mismatch, sensor linearity, sensor calibration factor uncertainty, sensor-to-signal mismatch uncertainty, and temperature effects. Of these, the two mismatch components often dominate.
If the signal to be measured is relatively large, you can minimize the mismatch uncertainty by placing a precision attenuator in the measurement path. Power reflected because of the impedance mismatch will be reduced by the attenuator on its way back to the signal source. If the attenuator characteristics are very stable and well known, inserting the attenuator should reduce the measurement uncertainty even though another element has been introduced into the circuit.
Many of the other measurement uncertainties relate to the power meter with which the sensor is used. Zero set and drift have been improved by design so that both effects are small in new meters. And, at very low levels, many power meters reduce their bandwidth and use averaging to enhance the signal-to-noise ratio. At higher signal levels, noise generally is not a problem. Sensor linearity remains as the next largest error source.
Sensors
Thermistors, diodes, and thermopiles are the more popular types of terminating RF sensors. Thermistors and thermopiles, as their names suggest, measure the amount of heat created by the RF signal. As such, these devices are not limited by video bandwidth or type of modulation. They accurately measure average RF power. Unfortunately, thermistors have only a limited dynamic range. New, integrated thermopiles are very linear but too slow in responding to a signal change to measure peak power, for example.
Diode-based sensors now have video bandwidths in excess of 35 MHz and, separately, a 90-dB dynamic range. However, there are many types of diode-based sensors, and they are not all created equal.
Basic Diode Sensor
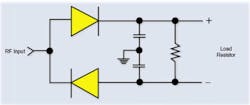
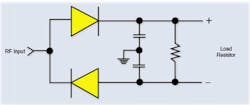
A Schottky metal-semiconductor diode naturally exhibits a square-law characteristic for low signal levels up to about -20 dBm. This means that the current through the diode is directly proportional to the square of the voltage across it. Sensors using two diodes in a full-wave rectifying arrangement, as shown in Figure 1, develop twice the output signal of a single diode circuit.
For low-level signals, this sensor circuit works well, generally requiring averaging and a chopper-stabilized amplifier to detect the very small signals corresponding to -70-dBm power levels. Nevertheless, the output is linear with power so accurate measurements result for any type of modulation if the peak power level remains below -20 dBm.
Bird Electronic, a producer of in-line-type RF wattmeters used in the broadcast industry, has developed the diode-based BPM Series Broadcast Power Monitors. With a 20-dB dynamic range, the family of sensors covers frequencies from 45 to 890 MHz and power levels from 50 W to 75 kW and works with any type of modulation having up to a 10-dB peak-to-average ratio. In addition, the monitor provides alarms based on excessive voltage standing wave ratio (VSWR) and low or high forward power.
In very wide dynamic range sensors, readings above -20 dBm must be corrected to compensate for the diode nonlinearity. When working with constant-amplitude power, CW, FM, and many PM signals, the sensor output can be averaged by the power meter before correcting the sensor�s nonlinearity at high signal levels. For a modulated signal with power levels above -20 dBm, this approach doesn�t work.
A different correction factor must be applied to each separate sensor output value before averaging. In this way, the proper correction is applied, and each sample represents the actual power level at the time it was sampled. Averaging then gives the correct result. Clearly, older systems that are designed to average first cannot be used for modern digital modulated signals with high peak-to-average levels such as wide-band code division multiple access (WCDMA).
The Micronetics Hand-Held Power Meter is a good example of a diode-based meter suitable for CW-only power measurements. Comprehensive specifications include an 80-dB dynamic range from -60 dBm to +20 dBm, VSWR <1.2:1 over the 100-kHz to 2.6-GHz frequency range, zero set error of 50 pW, and �3.5% calibration factor uncertainty. The meter performs background calibration automatically and includes a 100-kHz to 2.6-GHz counter.
Modulation Sensors and Peak Power Sensors
If a power meter and sensor combination is designed to digitize first and average second, then compensation for power levels above -20 dBm becomes practical for all types of modulation. Manufacturers including Boonton and Giga-tronics have developed systems using this approach.
A wideband peak power sensor is a diode sensor with sufficient bandwidth that it can follow a high-speed modulation envelope without error. A modulation sensor is a lower bandwidth peak power sensor. The sensor has sufficient bandwidth to follow the envelope of a particular modulation scheme but not more. Reduced bandwidth avoids measurement errors caused by higher frequency noise. Some manufacturers simply list reduced bandwidth values, and others refer to separate modulation sensors.
When a peak power sensor�s output is sampled, the samples represent instantaneous values of the peak power. If a succession of values were acquired and each one corrected to account for the sensor�s nonlinearity, a power vs. time profile of the modulation would result.
In fact, Boonton�s Model 4500B Power Meter and associated sensors operate in this way. The 4500B performs a variety of mathematical operations on the peak power samples to derive the maximum, minimum, and average power and statistics such as the standard variation and variance. Displays of the cumulative distribution function (CDF) and its complementary form (CCDF) as well as histograms showing the distribution of power levels within a time period also are provided.
According to Richard Theiss, product manager and senior applications engineer at Boonton, �Technical advances that contributed to the 4500B improvements include high-speed, high-resolution ADCs with good linearity and new high-speed differential amplifiers that support a full differential signal path from detection to A/D conversion. Improvements in DSP and field-programmable gate array (FPGA) technology also have contributed to the faster measurement and analysis speed.�
Nevertheless, the detailed implementation of diode sensor correction above -20 dBm is difficult to achieve accurately. Both Boonton and Giga-tronics calibrate their peak power sensors using a power calibrator that steps through the sensor�s dynamic range. For higher power levels, this technique provides accurate power measurements, assuming that the amplifier following the sensor maintains a constant bandwidth for all signal levels.
Obtaining a large dynamic range from a corrected diode sensor forces compromises to be made between large and small power levels. The sensor load resistor along with the associated integrating capacitors set the sensor time constant�the bandwidth. This value always involves a trade-off between greater sensitivity gained by having a large resistance or higher bandwidth that requires a smaller resistance. Dynamic range is lost in high-bandwidth peak power sensors because the load resistance must be small.
To regain a large dynamic range, some power meter/sensor systems may change bandwidth depending on signal level. This is not a new idea. At low power levels, conventional CW power meters reduce bandwidth and increase the number of averages used to combat noise. However, a CW signal, by definition, exists only at one power level.
Modulated signals, in particular WCDMA and similar technologies that inherently have very high peak-to-average signal excursions, provide many different power levels closely spaced in time. If the measuring system bandwidth for low-level signals is smaller than for high-level ones, the sensor output doesn�t represent the peak power for all parts of the signal. If you are interested in average power, this may not be a problem because at low levels the diode sensor accurately measures power and a lower bandwidth naturally tends to average the signal peaks.
However, communications systems using digitally modulated signals rely on the statistics of the composite signal. Unless the peak power always is represented by the sensor output, the statistics derived from the sampled output will be in error. These considerations are among the reasons that peak power sensors claim a smaller dynamic range over which a constant bandwidth can be guaranteed.
Agilent Technologies recently introduced new P-Series Power Meters and Power Sensors. The 18-GHz N1921A and 40-GHz N1922A are peak power sensors with greater than 30-MHz video bandwidths. The N1911A single-channel and N1912A dual-channel power meters sample at up to 100 MHz.
According to Sook Hua, product marketing for Agilent�s Basic Instruments Division, �The P-Series Sensors use differential signals to minimize noise and offset even at the high sampling rate. The new sensors include an embedded EEPROM that stores factory calibration data to correct the effects of temperature, power level, and frequency. And, accuracy is ensured by performing an autozero and autocal every 15 minutes.�
The 55-dB dynamic range of these sensors, from -35 dBm to +20 dBm, compares to that of other Agilent wideband sensors. The E9323A/E9327A Peak Power Sensors have a 5-MHz video bandwidth, and the dynamic range covers -32 dBm to +20 dBm.
Similarly, the 35-MHz bandwidth Boonton Model 57340 Peak Power Sensor handles power levels from -24 dBm to +20 dBm. The Giga-tronics Model 16936A High-Speed Sensor with less than 15-ns rise time has a -20- to +20-dBm dynamic range for peak power measurement and -40-dBm to +20-dBm for CW power. Anritsu�s Model MA2411B Pulse Sensor covers -20 to +20 dBm and features a rise time less than 8 ns when used with the ML2490A Series Power Meters.
For radar and other very fast, pulsed applications, the Anritsu ML2490A Series Meters provide a 65-MHz bandwidth and repetitive sampling to achieve the equivalent of 1-ns timing resolution. Any of the manufacturer�s MA2400 Series Sensors can be used with the meter although the meter�s capabilities suit it to high-speed peak power measurements.
�The increase in sample resolution from 16 ns to 1 ns has been achieved using a random repetitive sampling mode that takes several sweeps of the signal and reconstructs the waveform at 1-ns resolution,� said Guy Purchon, product marketing manager for the company. �The breakthrough has been accomplished by using a high-speed ADC, narrow aperture sample and hold, and a 1-GHz synthesized timing reference that timestamps each of the samples so the signal can be reconstructed.
All the examples of fast, diode peak-power sensors serve to illustrate the trade-off between speed and sensitivity. Although improvements continue to be made to sensor accuracy and power-meter bandwidth, there is no indication that a wide dynamic range peak power sensor will ever be available. The loss of sensitivity with increasing speed is a basic limitation.
Multipath Sensors
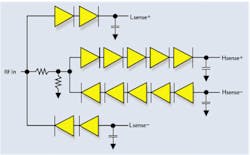
Hewlett-Packard was the first of the manufacturers to adopt a multipath sensor architecture in the E9300 Series Average Power Sensors (Figure 2a). The signal in the high-level path was attenuated by 50 dB so that the diode sensors remained in the linear power region for input signals from -10 to +20 dBm. The other path was not attenuated so the diode pairs worked with input signal levels from -60 to -10 dBm. In this way, the two sets of detectors never were working outside of their linear power regions.
Several diode stacks are shown in the circuit diagram. By placing m diodes in series, a 10 log(m)-dB improvement in the dynamic range can be achieved. 10 log(m) dB of sensitivity is lost at the low-level end of the range, but 20 log(m) dB is gained at the less sensitive end. In effect, the square-law region of operation is shifted 10 log(m) dB higher in power and extended by a like amount.
The main problems with this two-path arrangement were associated with switching between the two paths. For example, a modulated signal with an average power of -15 dBm and peaks 15 dB higher will drive one sensor into its nonlinear region but represents a very noisy, -50 dBm low-level signal for the other sensor. Because switching between the sensors takes several milliseconds, it�s not possible to accommodate the modulation peaks of this example. Also, applying a signal in which the power level switched between high and low with a low duty cycle and at a rate similar to the sensor�s switching rate could confuse the sensor switching logic.
However, it is possible to manually control the switching. The two-path sensor did provide accurate average power readings for signals with power levels within either of the two ranges without requiring complicated correction schemes.
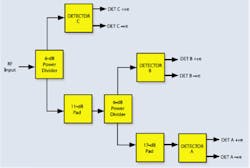
Anritsu extended this idea in the MA2481B Universal Sensor with three paths (Figure 2b). The switching points in this arrangement are at -3.5 dBm and -23.5 dBm. Detector A with 40 dB of attenuation is used for input signal levels from +20 to -3.5 dBm. Path B covers -3.5 dBm to -23.5 dBm and has 23 dB of attenuation. Path C with 6 dB of attenuation handles signal levels from -23.5 dBm to -60 dBm for an overall 80-dB dynamic range.
Using three paths improves noise performance at the switching points. In the MA2481B, the minimum signal level is -46 dBm at either of the switching points. The benefits of lower noise are faster switching and less measurement uncertainty as the sensor switches from one path to another. In addition, the least attenuated of the paths can be used separately in a CW-only mode.
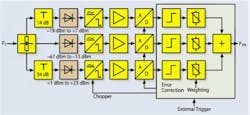
Rohde & Schwarz is the latest company to join the multipath trend. In this newest sensor implementation, the Model NRP-Z shown in Figure 2c, many of the limitations associated with the previous circuits have been eliminated. In fact, the sensor is a complete power meter and can be used with a PC as a controller. Alternatively, a separate power meter offers intuitive operation and displays up to four measurement results simultaneously.
But, the NRP-Z sensor is the real story. Using so-called smart sensor technology, the outputs of each of the three parallel, chopper-stabilized detector paths are digitized and processed on the fly to develop the final output signal. The control logic determines which of the outputs to use and works with 6-dB wide overlap regions to ensure a smooth transition. This is a true-rms three-path sensor with no data acquisition interruptions due to switching.
The sampling rate of approximately 120 kHz supports a low 10-MHz minimum RF carrier frequency. The upper limit depends on the sensor model: the NRP-Z11 for use up to 8 GHz and the NRP-Z21 to 18 GHz. Video bandwidths are 50 kHz and 100 kHz, respectively, for the two sensor models.
The North American Product Manager Justin Stallings said, �The multiple diode architecture combines several zero-biased Schottky diodes connected in series and integrated on a single chip. This approach expands the detector�s square-law region because the measurement voltage is split among several diodes so that each one is driven less while the detected voltages of the individual diodes are added together.
�The advantages over conventional technology,� he explained, �are high signal-to-noise ratio, low modulation effect, negligible delays and discontinuities when switching signal paths, and the capability to perform time-domain analysis of the test signal within the available video bandwidth.�
An Alternative Technology
Complementing existing thermal and diode-based RF power detectors, Analog Devices has developed a demodulating logarithmic amplifier. The AD8318 device provides a 55-dB operating range with �1.0-dB accuracy from 1 MHz to 6 GHz. A fast response time of 10 ns enables burst detection to beyond 45 MHz, and the IC also exhibits very good temperature stability.
|
FOR MORE INFORMATION |
| Agilent Technologies | P-Series Power Meters | www.rsleads.com/603ee-217 |
| Anritsu | ML2490A Power Meter | www.rsleads.com/603ee-210 |
| Berkeley Varitronics Systems | Butterfly and Caterpillar Power Meters | www.rsleads.com/603ee-211 |
| Bird Electronics | BPM Series Broadcast Power Monitors | www.rsleads.com/603ee-212 |
| Boonton Electronics | 4500B Power Meter | www.rsleads.com/603ee-213 |
| Giga-tronics | Model 16936A High-Speed Sensor | www.rsleads.com/603ee-214 |
| Micronetics | Hand-held Power Meter | www.rsleads.com/603ee-215 |
| Rohde & Schwarz | NRP-Z Power Sensors | www.rsleads.com/603ee-216 |
Two Berkeley Varitronics Systems wireless products, Butterfly� and Caterpillar�, are intended for use with 802.11a, b, and b/g wireless local area networks (WLANs). Both instruments use the Analog Devices RF detector but in different ways.
�Butterfly is a hand-held power meter that measures both 2.4-GHz and 5-GHz frequency bands to verify power level from 0 to +30 dBm in 1-dB steps,� said Henry Szczurko, an RF design engineer for the company. �Power is displayed increasing from left to right as a moving bar graph or graphically as a function of time.
�In contrast,� he continued, �Caterpillar is a hand-held sweeping analyzer. This allows not only for measurements of the power level, but also for the detection of the channel/frequency of the 802.11-compliant equipment. The analyzer can be set to sweep through either or both 802.11 bands. It also can monitor power on any particular channel in the range from 0 to 30 dBm in 1-dB steps. The power profile mode detects equipment with faulty output filters.�
Summary
Some types of RF power measurements are easier and cost less to accomplish than others. For example, if your application involves robust signals with limited dynamic range, frequencies of a few gigahertz, and only FM or no modulation, almost any RF power meter will meet your needs. Some will be more accurate or faster reading than others, some will offer a wide choice of sensors for other applications, and a few will accomplish your requirements in a small hand-held unit at minimal cost.
Measurement cost goes up with increasing video bandwidth, dynamic range, and modulation bandwidth. For example, most high-performance sensors must be used with a complementary power meter. The Rohde & Schwarz NRP-Z Sensor is the exception, being a complete power meter that can be directly connected to a PC for control and output display.
It�s always true that you should thoroughly understand your real needs before buying equipment. But, it�s even more important when buying a power meter because there are so many to choose among and they differ one from another in very important but small details.
For example, does the combined sensor/meter bandwidth change with power level? If it does, how much does it change, and will that affect the accuracy of your power readings? If a meter autocals periodically, can you manually defeat that feature? What short- and long-term stability can you expect without autocal being enabled? How does measurement speed degrade with signal level? Measuring very low-level signals can require more than a thousand averages.
These are only a few of the types of questions that must be asked before buying, not afterwards when the answer could be a big disappointment. Power meters are becoming more complex as they gain enhanced triggering and display capabilities akin to those of digital storage oscilloscopes. Nevertheless, basically, the meters measure power. Understanding what the meter and sensor are doing to signals at various power levels is a good way to start differentiating one product from another.
March 2005
