A Test Strategy for Pre-Reflow AOI
One high-volume OEM proves that even simple feedback from an AOI system can reduce end-of-line defects by an order of magnitude.

Manufacturers who implement pre-reflow optical inspection generally fall into one of four groups: those who build wireless products with RF shields, which typically are applied before the reflow oven and prevent 100% post-reflow optical inspection; those who build high-reliability products and need to do it right the first time; new product introduction centers that need to get paste-and-placement equipment up and running quickly and efficiently for each new board type; and those who believe that earlier detection and prevention will improve yields.
Manufacturers interested in process control wonder whether they need to be experts in statistical data analysis and process control procedures to get value from pre-reflow automated optical inspection (AOI) machines. The answer is that even simple feedback from a pre-reflow optical inspection system can produce dramatic results in tuning the process and keeping it under control.
One Manufacturer�s Experience
This article chronicles one manufacturer�s application of post-place/pre-reflow AOI over a five-month period. Prior to installing the Optima 7200 Post-Place/Pre-Reflow Optical Test System, roughly 10% of the boards built had a gross defect or major fault. The system was installed, and the results were carefully measured over several months.
The company, a major North American OEM manufacturer of car radios, used the new defect and measurement data from the AOI system to identify and repair the defects and perform simple placement-machine corrections. By taking these actions, the OEM reduced the number of end-of-line defects by an order of magnitude. In addition, through the ongoing use of the system in production, this improved level of performance remained steady over time.
User Application and the Problem
The high-volume, high-speed line is used to assemble automotive radios. One board is built approximately every seven seconds. Each PCB is a single board with 120 parts. An RF shield is placed on the board prior to the reflow oven. The line runs three shifts per day and builds roughly 7,500 boards a day.
The manufacturer developed a need for pre-reflow optical inspection based on two issues. First, one board required an RF shield to be placed before the oven. With the RF shield on the board prior to reflow, optical inspection after the oven was not possible for a number of the parts.
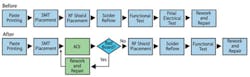
Secondly, the company�s manufacturing process mandated an eight-hour wait between functional test and final electrical test. This resulted in a scenario where many bad boards potentially could be built before all the defects and process issues were identified at final test. The customer wanted to use AOI after placement and before the oven to identify defects earlier in the process (Figure 1).
As a result, the assignment was to develop an optical inspection strategy for this assembly line. The goal was two-fold: use AOI to find and correct defects prior to the oven and determine what was causing the defects.
The Solution: Pre-Reflow AOI
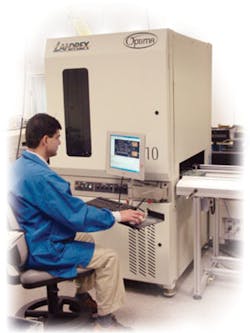
The solution was to install a Landrex 7200 in line before the RF shield placement machine. The AOI system performs 100% inspection of the components and provides two types of data:
� Attribute�part missing, misplaced, and wrong orientation.
� Variable�positional information regarding the measured position of the part relative to its expected X, Y, and theta placement.
Boards that pass 100% of the optical inspection tests are sent to the RF shield placement machine and then into the oven. Boards with gross faults are sent to a review-and-repair station.
Manual inspectors review each fault and fix the component problems. Boards repaired by the operators then are reinserted into the post-place inspection system.
Additionally, any new faults introduced by the operator are found by the AOI system and the boards returned again for repair. The cycle continues until each board passes optical inspection. The AOI system logs 100% of the part positional data into a database for review by the line manager.
The Results: Before and After
The manufacturer did a careful study of the defect classes prior to installation of the pre-reflow optical inspection equipment. The majority of the defects were missing parts followed by mispositioned parts. A minority of the defects related to inverted parts or reversal of polarity. The weekly average for defects was roughly 7,000 ppm.
After the three-month control study, the manufacturer inserted the AOI system into its process. The results of the machine were monitored over a two-and-a-half month period.
During this time, roughly 500,000 boards were built. The overall end-of-line defects dropped an order of magnitude from 7,000 ppm to approximately 700 ppm. Most importantly, while using the optical inspection machine, the defects, as measured on a weekly basis, remained roughly stable at 700 ppm with a standard deviation of roughly 400 ppm across the weeks.
Using Measurement Data to Find Faults
After inserting the AOI system into the process, the car radio manufacturer found that mispositioned parts constituted the majority of the remaining defects. However, this defect class also was substantially reduced by introducing the optical inspection equipment.
After looking at the data, an investigation was launched to discover why mispositioned faults still dominated the fault spectrum. If the AOI system provided reliable measurement data regarding the position of parts, these defects should have been caught and rectified.
The defect class of mispositioned part is an interesting challenge. Most AOI equipment only provides go, no-go or attribute data regarding whether or not a fault exists. Fault classes such as missing or misoriented are well served by this type of diagnosis because these faults usually are unambiguous.
However, the fault class of a mispositioned part is more complicated. For an optical inspection system to determine whether a part is misplaced or not, it must, by definition, find the part�s current position and compare it to its expected position. Based on user-defined limits, the system then can determine if the part is placed outside the acceptable boundaries.
Typically, you would like the measurement system to have a resolution and repeatability of measurement 10 times better than that of the pick-and-place systems. For a 0402 component, for instance, the desired specification for a measurement machine is an accuracy of 100 microns and a repeatability of 10 microns. Optical inspection systems that have only gross fault analysis or do not have the accuracy and repeatability of the Optima 7200 cannot give a good and reliable diagnosis of mispositioned parts.
As a result, the queue for failing boards would grow longer than the capacity to store the failing boards and overwhelm the operators. When the number of failing boards in the queue reached a certain level, an alarm would ring, and the line would stop. Naturally, this is not a desirable condition for any production line.
To prevent this situation, the AOI programmer often would relax the failure criterion from 50% off-pad to 70% off-pad. This greatly reduced the failures and load on the operators, but it also allowed real defects to escape in the process. This scenario represents an interesting trade-off of tight limits and high positional failures vs. loose limits and low positional failures seen at many customer sites.
Using Process Control
If many parts are failing for position, then perhaps there is a larger problem earlier in the process. The manufacturer, by analyzing the information provided by the AOI machine, determined different levels of root causes.
For instance, one study found that one of the four placement systems was responsible for 71% of the defects. In another study, placement setup issues were discovered with many of the 0402 resistors and capacitors as well as the SOT-23 components.
The decision whether to fix these issues with repair operators or at the placement-machine level is a difficult one. Certainly, problems fixed at the placement-machine level will help prevent defects. The issues for this manufacturer were determining how often it was necessary to analyze the data and who would be responsible for fixing the pick-and-place system. Additionally, if there wasn�t sufficient evidence that the issues had systemic rather than random causes, could the company afford to stop the line to tune the placement system?
The jump from performing post-place inspection and defect repair to implementing process control strategies is difficult. It certainly takes time, effort, and a willingness to stop the line to make the changes. However, this manufacturer found that acting periodically on even the simplest analyses of the data could help to stop current defects and prevent future ones.
Preventing Post-Reflow Defects
Many manufacturers are reluctant to depend only on in-process, pre-reflow optical inspection and not post-reflow inspection. They believe that post-reflow defects, mostly solder-joint related, will not be caught by the pre-reflow inspection. Manufacturers also feel that placing machines post-reflow is a better use of capital because a post-reflow inspection system can catch all the defects.
On the other side, in-process camps feel that if the paste is applied correctly, the parts are placed in the correct position and the oven profiles have been set correctly, then there should be very few post-reflow defects. Naturally, finding defects early in the process means that they can be rectified before too many bad boards are built.
The manufacturer was able to profile the post-reflow defects on the failing boards to look for solder bridges. In the initial stages of the study, solder bridges accounted for, on average, 7% of the total defects produced by the process prior to repair. This manufacturer did not use separate paste inspection. If the company had combined pre-reflow place and paste inspection, that number could have been greatly reduced.
Summary
The car radio manufacturer effectively implemented a pre-reflow, post-place inspection strategy that reduced end-of-line defects by an order of magnitude. Some simple process control strategies were used as well as operators who reviewed and repaired the defects. Given the exceptional gains in yield obtained after implementing the pre-reflow inspection solution, the example serves as a good case study of the effectiveness of such inspection strategies.
About the Author
Pamela Lipson received a B.A. from Harvard University and M.S. and Ph.D. degrees from the Artificial Intelligence Laboratory at MIT. In 1997, Dr. Lipson and her colleagues won the MIT Entrepreneurship Competition and, as a result, launched Imagen to develop computer-vision technology for commercial applications including the automated inspection of electronics. She currently is a member of the Board of Scientific Advisors at Landrex Technologies. Landrex Technology, 309 Laurelwood Rd., Suite 22, Santa Clara, CA 95054-2313, 408-567-9801, e-mail: [email protected]
July 2006
About the Author
Comment About the Article
To join the conversation, and become an exclusive member of Electronic Design, create an account today!

Leaders relevant to this article: