A displacement or error referenced to a signal�s ideal timing is called jitter. For example, if the positive-going edges of a clock signal are used as the timing reference for a digital circuit, then any deviation of the actual clock edges from their ideal positions constitutes jitter.
The reason for interest in jitter is because, at a sufficiently high level, it makes circuits fail. If a communications link, for example, must operate with only one error in 1012 b, a common specification, then the total jitter must be less than the amount of jitter corresponding to a 10-12 bit error rate (BER).
�[As speeds increase,] the margin between what the silicon actually is doing [such as in a high-speed communications chip] and the required specification is shrinking,� commented Steve Lomaro, business development manager at Verigy. �This has forced jitter measurements to the forefront, both in design validation and production testing.�
Amplitude and timing errors may be interrelated, but jitter only deals with timing. For example, an eye diagram displays both a signal�s timing and amplitude behavior and optionally a mask representing the minimum specified performance. Jitter is measured in the horizontal direction and shows up as a broadening of the area where the traces constituting the eye pattern cross through each other.
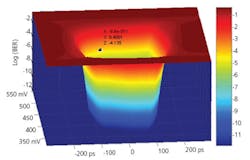
What are not seen in most eye diagrams are the very infrequent late or early signal edges corresponding to low BER values. Some instruments, such as SyntheSys Research�s BERTScope�, can estimate BER contours that show the degree to which the eye would become closed at very low BERs. Closure is caused by the rare edges that occur farther and farther from the nominal crossing point.
The stability required in such an instrument is extreme. Tom Waschura, chief technical officer and cofounder of SyntheSys Research, explained, �Our delay line design provides quick, accurate, automated recalibration for timing repeatability to less than 100 fs. This translates into highly accurate timing positioning for the BER measurements used in estimating total jitter (TJ) at the 10-12 level.�
Tektronix also can display what the company calls a multi-dimensional BER eye that includes both amplitude noise and timing jitter effects. A typical 3-D color plot based on the recently introduced 80SJNB measurement capability is shown in Figure 1.

Many different types of instruments as well as on-chip circuitry are used to measure jitter. Depending on the technique adopted, different but related measurements may be made. In one case, the variation in clock period width from the ideal will be recorded. This quantity is termed period jitter. Cycle-to-cycle jitter is the change in period width from one clock cycle to the next.
A third measurement records the time difference between the actual edge placement and its ideal position. This quantity is the timing interval error (TIE) associated with each clock edge. Because jitter is not cumulative, the average timing of a large number of clock cycles equals the ideal clock period. Some instruments derive the ideal clock in this manner. It also is possible to synchronize a hardware clock generator to recover a stable reference signal for use when measuring data jitter.
However, unlike scopes and BERTs, TIAs typically cannot measure a large number of very short consecutive time intervals. Rather, for a high-speed clock, the interval measurements represent an undersampled subset of the clock intervals selected from a much larger number of clock cycles.
Traditional equivalent-time sampling scopes also cannot acquire successive clock cycles. This instrument always requires a repetitive signal. For jitter analysis, it measures time from the beginning of one event to the end of a similar but different event in a repeating pattern. Accurate timing can be provided, but acquiring data representing thousands of clock edges takes a long time. TIAs are orders of magnitude faster than sampling scopes because a TIA directly records the event threshold crossing timing.
The TJ that occurred during a period of time generally is measured adequately by any of these instruments although they use different techniques. Because each instrument acquires data differently, however, don�t expect exactly the same values.
Two fundamental reasons for measurement differences were discussed by Dr. Mike Lauterbach, LeCroy�s director of product management. �TIAs measure the jitter of each edge in a data pattern using the first edge as the start time. Typically, scopes determine jitter relative to recovered reference clock edges. Although both types of instrument report TJ, random jitter (Rj), and deterministic jitter (Dj), they are measuring different quantities.� He explained, �We now include the facility to choose either TIA-like edge-to-edge jitter or reference-to-edge jitter using recovered clock edges.
�Inconsistent jitter measurement results also can arise if a different phase-locked loop (PLL) is used to recover the embedded clock. LeCroy offers several choices of PLLs to match the fiberchannel, PCI Express, or DVI standards, or the user can input a customized PLL model,� he concluded.
Chris Loberg, market development manager at Textronix, added, �The variety of standards has led to too many variables being defined and recommended for proper jitter measurements. As well, the increasing data rates have added to the already complex nature of validating signal integrity.
�The complexity of serial signaling approaches combined with a dramatic increase in copper-based data rates has led to some measurement challenges,� he continued. �In recent studies with customers where we have seen jitter results variation, we�ve found different clock recovery methods used, different measurement bandwidths, and a host of related issues.�
Measurement Details and Consequences
If successive clock cycles are identical but slightly larger than the ideal clock period, called a unit interval (UI), each will have the same measured period jitter. That is, each will differ from a UI by the same amount of time. Cycle-to-cycle jitter measures the deviation from one clock period to the next. So, if a number of successive clock periods are all too large but equal, the cycle-to-cycle jitter will be zero.
However, the time interval error (TIE) will become larger for each of these clock edges. The TIE measures the position of a clock edge with respect to that of an ideal clock and the TIE is the integral of period jitter. For example, if a spread-spectrum clock is used to reduce EMI, the modulation created by this technique changes the clock period width. A TIE measurement will integrate the spread-spectrum modulation waveform. A period jitter measurement will display the actual modulation waveform.
Expressing these definitions mathematically
Timing Jitter:
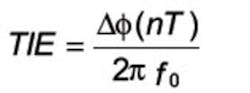
where: (nT) = the nth zero crossing of a clock signal with a period T
Period Jitter:
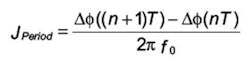
which is the difference in edge position, equivalent to the change in the TIE from cycle to cycle. Although this is a difference equation rather than a differential equation, it should be clear that period jitter represents the rate of change of timing jitter.
Further information can be determined from a long time record of either TIE or period jitter. For example, the maximum peak-to-peak value of either quantity is found by taking the difference between the maximum and minimum values measured within the record. The maximum jitter a circuit is likely to see in service is an important design specification. Similarly, knowing that the rate of change of jitter is limited below some value may be critical in some applications.
These kinds of considerations naturally lead to questions about different components of jitter. For example, if only random jitter is present, then measuring the circuit�s performance can be unsettling: The longer the circuit is observed, the greater the peak-to-peak jitter becomes.
Truly random jitter has a Gaussian probability distribution function (pdf), which means that, theoretically, any amount of instantaneous jitter is possible if you wait long enough. On the other hand, deterministic jitter, such as might result from unintentional switching power supply crosstalk, has well-bounded limits on size.
Distinguishing Among Jitter Components
The two major divisions of jitter are Rj and bounded Dj. Decomposition into these components is the basis of schemes that go much further, distinguishing among periodic jitter (Pj), bounded uncorrelated jitter (BUJ), and data-dependent jitter (DDJ) including intersymbol interference (ISI) and duty cycle distortion (DCD).
In 1999, Wavecrest presented a paper at the International Test Conference (ITC) that described a method of separating Rj from Dj through distribution tail fitting. The method was prompted by recognition that a single Gaussian pdf could not properly represent jitter composed of both Rj and Dj.1
The random element contributed to the long low-probability pdf tails that could not be associated with bounded Dj. On the other hand, the central part of the distribution could not have a Gaussian shape because it represented some combination of the separate Rj and Dj components. Several companies and committees have spent a great deal of time determining how best to estimate these two distributions.
TIAs and some new scope-based approaches directly determine the timing of each edge measured. Typically, a TIA separately measures the timing variation associated with each edge in a repeating pattern. This technique ensures that none of the measured jitter is due to DDJ�the data is not changing.
The FFT of the acquired event timing can reveal frequency peaks corresponding to Pj. If these are eliminated, the remaining information represents Rj. If data is collected for a pattern edge and averaged, then only Dj should remain. Through this kind of process of elimination, a TIA can estimate each component of jitter and convolve them to determine TJ.
A continuous TIA (CTIA) is a type of TIA made by GuideTech. Rather than generate a group of accurate but unrelated samples, the Model GT4000 CTIA times each event from a common reference time. This means that the separate events retain a time-order and the TIE can be measured directly. Because little memory is required to record each event, a CTIA typically can acquire high timing resolution events for a much longer total time than a DSO, for example.
Sassan Tabatabaei, the company�s chief technical officer, explained, �Because the DDJ and Pj components are separated from the samples before attempting to estimate Rj, the Rj-dominated region starts at BER levels as high as 10-4. This procedure minimizes the number of samples required to perform Q-Scale analysis.�
The Agilent Model 86100C DCA-J Sampling Scope uses a new architecture that includes pattern synchronization and eliminates the need for a separate pattern trigger. To overcome the typically very slow edge-transition time measurement associated with sampling scopes, the 86100C uses calibrated models of representative edges to interpolate the threshold crossing time. Jitter decomposition similar to that performed by TIAs is accomplished using these features of the scope�s architecture and new jitter algorithms. TJ again results from convolution of the various jitter components.
Coherent interleaved sampling (CIS) is a unique aspect of some LeCroy scope models. With CIS, repetitive sampling of one or more edges of a repeating pattern can be accomplished at approximately a 10-MHz rate and without a separate external pattern trigger. Because the data pattern can be held stationary relative to the CIS clock, jitter subcomponents can be quickly determined and, from them, TJ estimated.
Dual-Dirac Model
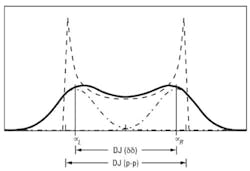
A separate and complementary approach, the dual-Dirac model has become a well-established yet controversial and sometimes misunderstood means of estimating the TJ at a prescribed bit error rate TJ(BER). This approach formalizes Gaussian tail fitting but introduces confusion because of its artificial model-dependent parameters. The D?? parameter, for example, is related to the peak-to-peak width of the Dj component but not equal to it.
D?? is the distance between the means of the left and right Gaussian pdfs as shown in Figure 2. Because the dual Dirac model assumes Dj and Rj are uncorrelated, convolution of the Gaussian Rj pdf and the measured Dj pdf results in the overall distribution. In this process, the edges of the Dj pdf and the Gaussian pfd are smeared together, resulting in reduction of the distance between the two Gaussian means. For practical cases, D?? is less than the peak-to-peak value of Dj.
However, if the use of the dual Dirac model is confined to estimating TJ(BER), the exact nature of Dj is unimportant, and the model does a good job. A Synthesis Research technical note stated, �In general, the dual-Dirac model does well separating Rj and Dj when the conditions involve Rj almost exclusively or Dj with small amounts of Rj. For situations in between, the results are more mixed. It is important to remember, however, that TJ(BER) is the main aim of the model, and this is characterized well.�2
From a TIA manufacturer�s point of view, �The concept of Q-Scale or dual-Dirac was invented so a BERT could separate Dj and Rj numbers from the TJ they can measure,� explained Dennis Petrich, senior vice president at Wavecrest. �BERTs cannot measure a data signal�s true transition density [the ratio of signal edges to total UIs] or know a Gaussian distribution. With the dual-Dirac model, BERTs can estimate Rj or Dj on a data signal indirectly, not by direct measurement. In contrast, Wavecrest�s SIA-4000 TIA can determine accurate values of DDJ for each data pattern of interest.�
Low BER Measurements
Measuring extremely low levels of jitter, counterintuitively, may not produce as accurate an answer as estimating the level. Even a small amount of amplitude noise-to-jitter conversion can heavily influence very low BER measurements. Nevertheless, the more information you have before trying to extrapolate to lower BER levels the better. Because a BERT directly measures BER and acquires information on every data bit, it�s practical to directly measure low BER values for high-speed circuits in a matter of a few minutes.
In contrast, an oscilloscope typically measures many points on each input clock cycle. Consequently, even with a very long memory, the number of bit position timing measurements is limited. Scopes can directly measure jitter but are unlikely to be as useful as a BERT for investigating very low BER values. Similarly, a TIA can accumulate accurate clock jitter measurements, but it is orders of magnitude slower than a BERT.
Regardless of the instrument type, two approaches typically are used to display low BER jitter characteristics (Figure 3). In one approach, the sampling time is gradually moved through the eye crossing point where traces cross through each other. Starting well to one side in the open part of the eye, BER will be nearly zero. As the crossing point is approached, more frequent errors will occur. A histogram relating BER and edge transition timing can be generated in this way.
Alternatively, starting at the eye crossing point where BER is very high, the sampling point can be delayed in small amounts, stepping across the entire eye. This process produces the bathtub curve. BER values are displayed in the vertical direction vs. time along the horizontal axis. The left side of the diagram corresponds to the BER associated with clock edges that occur late and the right side to BER for early edges.
This technique is used in Verigy�s 93000 ATE with Pin Scale HX board. Michael Braun, senior application consultant, explained, �We sample a repeating pattern at speed, typically measuring the BER on a long pseudorandom bit sequence (PRBS) pattern. Before the pattern is repeated, we move the compare strobe position a small amount in time and capture the BER. Continuing in this way develops the data to plot a traditional bathtub curve.�
The approach sounds straightforward, but as Mr. Braun emphasized, it implies very high linearity in the strobe timing circuitry. �If you program your compare strobes with picosecond-resolution but the system cannot achieve it, and instead between each program step you move 30 ps to the right or 40 to the left, the process will generate garbage. So, for this type of jitter testing we ensure that the linearity really can be achieved and that signal integrity has been maintained.�
A 2004 document, �Methodologies for Jitter and Signal Quality Specification,� known as MJSQ, often is quoted in relation to techniques needed to make meaningful measurements of very low-level BER. For example, a PRBS often is generated to measure BER, but no matter how long it is, the sequence is deterministic. Specific bit patterns may occur only once during the entire sequence, but beyond that low BER value, Rj tails must be estimated and extrapolated.
�For a PRBS-31 with approximately 2 billion bits�points should only be included that were measured at a BER of 2.3 � 10-10 and below. [This recommendation has implications]�the accuracy of any extrapolation is dependent upon the number of measured points, as this is the best way of averaging out the effects of noise. When the first points should be taken below 2.3 � 10-10 and several measured points are required for accuracy, it can be the case that waiting for points to make an accurate extrapolation to 1 � 10-12 can end up involving measured points taken at 1 � 10-12, negating the need to extrapolate.�3
Decomposing Dj
The difficulty in establishing robust rules to determine Rj and Dj and then the Pj, DCD, ISI, and BUJ components within Dj is a major reason why different instruments produce different values of decomposed jitter. Another good reason is that until recently there has been little agreement on how jitter test signals should be generated and measured. For example, Agilent Technologies worked with NIST to develop well-characterized types of jitter. Knowing exactly what the generator was producing lead to better correlation of instrument results.
Several white papers and products recently have appeared based on correlation of measured results with known input signals. Applying a signal with specified amounts of Rj and Dj, for example, can test the performance of a jitter decomposition algorithm. This procedure has been used extensively in development of the latest Amherst Systems Associates (ASA) M1 Oscilloscope Tools product.
Mike Williams, the company�s owner, said, �We built a synthesizer that can create all of the various kinds of stationary jitter you can expect to encounter. The synthesizer is used to push 10 million flavors of jitter through�the decomposition method we fashioned�.There are places where the results differ quite significantly from what was synthesized�[but] they are extremely consistent and repeatable�.A neural network-based system�attempts to calibrate the difference between expected and actual�.
�Most recently,� he continued, �we�ve found some dependencies on jitter behaviors that can be further improved by moving from static to dynamic calibration. The improvements�will make an observable difference especially on live data and�on data that has moderate to significant ISI.� In addition, version 4.05 of the company�s M1 product subtracts out the effect of a scope�s own noise, improving the Rj estimate.
Certainly, the lower the noise contributed by the measuring instrument, the better the jitter estimate can be. On the other hand, some of the assumptions upon which the Dual-Dirac model is based are themselves suspect.
|
FOR MORE INFORMATION |
| Agilent Technologies | 86100C DCA-J Jitter Mode | www.rsleads.com/701ee-176 |
| Amherst Systems Associates | M1 Oscilloscope Tools | www.rsleads.com/701ee-177 |
| GuideTech | GT4000 CTIA | www.rsleads.com/701ee-178 |
| LeCroy | SDA-18000 with Q-Scale | www.rsleads.com/701ee-179 |
| SyntheSys Research | BERTScope | www.rsleads.com/701ee-180 |
| Tektronix | 80SJNB Jitter, Noise, and BER Analysis Software | www.rsleads.com/701ee-181 |
| Verigy | V93000 Pin Scale HX Card | www.rsleads.com/701ee-182 |
| Wavecrest | SIA-4000D | www.rsleads.com/701ee-183 |
ASA�s Mr. Williams frequently challenges current jitter decomposition methods in his company�s newsletter. ITC jitter presentations and white papers written by many industry leaders also suggest that there are exceptions to more simplistic Rj/Dj approaches.
One questionable assumption is that Dj follows a finite, bounded distribution. In simple cases with one or a small number of deterministic sources contributing to the overall Dj distribution, this is true. However, if a large number of small contributions add in some way to form the overall Dj distribution, the central limit theorem says that it will approximate a Gaussian pdf. In this case, distinguishing between the behaviors of the almost-Gaussian bounded Dj tails and the truly-Gaussian Rj tails is very difficult. The usual extrapolation necessary to estimate the jitter corresponding to very low BER is prone to errors.
Another assumption is stationarity. This property of statistical distributions means that the distribution is not a function of time. In other words, the results of typical jitter measurements don�t depend on when they are made. However, real signals don�t have totally separate amplitude and timing variations. The two interact and can lead to a degree of nonstationarity. Reference 3 concluded that the assumption of stationarity simply can�t be proven because none of the different types of test instruments captures and analyzes a continuous data stream.
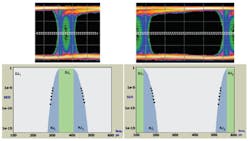
Q-Scale, a relatively new presentation of jitter vs. BER, helps to verify that assumptions about Rj/Dj were correct. As shown in Figure 4, a Q-Scale diagram transforms the two sides of the traditional bathtub curve into straight lines. The slopes of the lines are equal to the standard deviations associated with the right and left Gaussian pdfs that have been convolved with the central Dj.
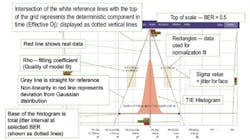
Because the jitter-BER relationship is presented in a linear way, it�s much easier for users to distinguish between data that really does fit a Gaussian and that which is only close. Nevertheless, Q-Scale is only a way to present jitter data. It has no effect on underlying assumptions.
Conclusion
If you want to be certain that your circuit meets a certain TJ(BER) specification, get a BERT. A BERT can continuously monitor the huge number of bits necessary to confirm a BER less than 10-12, for example. Of course, even with a multigigahertz clock, this may take a while and not be suitable for production testing. Nevertheless, all manufacturers agree that if you really need to measure BER to a very low level, a BERT is the way to do it.
Other types of instruments emphasize capabilities, such as jitter decomposition, that a traditional BERT does not provide. Also, oscilloscopes with a jitter measurement facility can be used as general-purpose test tools when not dealing with jitter. So, there also are reasons not to buy a BERT.
Further, production test requirements are different from those of the design lab. Speed, stability, and repeatability are more important than absolute accuracy because, with stability and repeatability, test results can be correlated. Several papers presented at the 2006 ITC made this point.
For example, Advantest�s T. J. Yamaguchi and several coauthors have presented eight papers at ITC since the year 2000 dealing with various production-oriented jitter measurement schemes. Low cost of implementation, high-speed operation, and repeatability have been the themes of these papers together with the need for sufficient accuracy to suit production needs.
The means to generate clocks and data patterns with known amounts of various types of jitter are important. If researchers agree initially on the definitions they are going to use, then regardless of the measurement method, the results of a similar type of jitter test should be consistent throughout the industry. We�re not there yet, but well-characterized jitter generation is a major step.
This theme was developed in detail in a paper delivered at DesignCon East 2005. The authors concluded their jitter correlation study with experiments involving mixes of Rj, Pj, and DDJ and several different models of oscilloscopes with jitter measurement capabilities:
�The correlation study showed that different jitter analyzers give vastly different results under different circumstances.�For any single jitter measurement, it is difficult to judge which analyzers are reliable. When jitter sources can be independently varied, it is easy to identify the utility of jitter analyzers under extreme conditions by comparing the results with well-understood behaviors and trends�.The key algorithmic techniques were to first separate the jitter contributions that were correlated to the data from that which was uncorrelated and then to equate Rj to the random noise of the jitter-frequency spectrum of the uncorrelated sample. Having obtained rms Rj [equivalent to the standard deviation of the Gaussian pdf], measurement of the dual-Dirac model-dependent D?? is simplified, and accurate estimates of TJ at low BER are straightforward.�4
Many other sources agree with this general methodology but also stress the need to understand the particular signal under test. For example, using a scope for PRBS testing requires that its memory be long enough to acquire all the bits in the sequence. As a guide, 216 bits require a 1-M memory assuming oversampling by a factor of eight.
Agilent�s Greg LeCheminant, measurement applications specialist, digital verification solutions division, elaborated. �The primary reason for jitter measurement uncertainty is the complexity of the signals being measured. To assess the magnitude of total jitter to very low probabilities,� he continued, �most measurement tools attempt to separate out the individual jitter components. When the jitter of a signal is composed of many types of jitter, the task is complicated. Models are used, and some assumptions about the signals being measured are required. The models and assumptions sometimes may not fit a specific complex jitter signal, and when they don�t, the results will be inaccurate.�
If you get results that don�t seem credible, some instruments have features that allow you to drill down to see what really happened. LeCroy�s ISI plot displays the piece of the waveform corresponding to excessive jitter and indicated by a signal edge hitting the forbidden zone in an eye pattern test. ASA�s Mike Williams suggested that searching for answers in the modulation domain is very productive when jitter values are excessive. And, SyntheSys Research�s Guy Foster emphasized the total voltage and time overview shown by BER contours.
There is no doubt that jitter is a problem with a great many solutions. They�re not all equivalent, and you can�t choose the best one for your application without studying the subject in some detail.
References
1. Li, M., et al., �A New Method for Jitter Decomposition Through Its Distribution Tail Fitting,� Proceedings International Test Conference 1999, IEEE Computer Society.
2. Foster, G., �Dual-Dirac, Scope Histograms and BERTScan Measurements�A Primer,� SR-TH045, Synthesis Research, September 2005.
3. �Jitter Analysis: The Dual-Dirac Model, Rj/Dj, and Q-Scale,� Agilent Technologies, 5989-3206EN, 2005.
4. Chow, D., and Stephens, R., �Methodology for Jitter Measurement Correlation and Consistency,� DesignCon East 2005.
January 2007
About the Author
Comment About the Article
To join the conversation, and become an exclusive member of Electronic Design, create an account today!

Leaders relevant to this article: