New waveform scanning techniques developed during the past year have made the task of troubleshooting automotive serial data designs systematic and precise. Several techniques support rapid characterization and debug of automotive signaling, including physical-layer scanning techniques applied to signals such as Controller Area Network (CAN) and Serial Peripheral Interface (SPI). These techniques also can be generalized to troubleshooting other types of undesirable behavior in automotive circuits.
Frequency Stability of Data Transitions
Identifying frequency stability problems within automotive serial data signals can be greatly simplified when using an automated method. The ideal bit period of a serial data signal is computed as the inverse of the bit rate and is the amount of time corresponding to a single logical one or zero in the data stream.
However, each actual bit period is not identical for every bit. When an oscilloscope measures each data period of a serial data signal, the value can be directly inverted to compute the instantaneous data frequency for that specific bit.
All-instance measurements is a technique of computing the value for all possible measurements within the acquisition. Instead of measuring only one data period within the acquired waveform, the series of instantaneous frequencies of each data period of an acquired input waveform can be computed as an array.
With a tolerance band applied to instantaneous frequencies, the array of contiguous instantaneous frequencies can be scanned with an oscilloscope to detect anomalous frequency content on a per-cycle basis. The waveform scanning technique incorporates this new approach and can report frequency anomalies graphically and numerically to identify all data periods outside of frequency stability margin requirements. Similarly, other timing parameters such as rise time, fall time, period, pulse width, and duty cycle could be used as waveform scanning criteria.
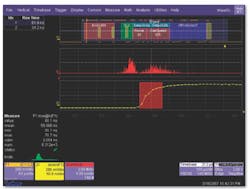
Shown in Figure 1, a 125-kb/s CAN bus signal is acquired with two single-ended probes that are subtracted in math trace F1 to present the differential signal. In addition to displaying physical-layer characteristics such as pulse width and rise time, a protocol-layer decode is overlaid onto the trace. Individual fields of the CAN message are identified with corresponding color-coded highlighting blocks.
For example, the ID field with hex ID 0x400 is highlighted in red while the cyclical redundancy check (CRC) is indicated in blue with a decoded value of hex 0x3cc7. Stuff bits, highlighted in brown, show the locations of bits whose polarities were intentionally reversed to reduce capacitive charge buildup during transmission.
Within the decoded data fields, each byte is individually highlighted and translated both hexidecimally and symbolically. For example, within the engine message, the power level of 42 W and cam speed of 928 rpm are individually decoded and displayed.
Analysis of Rise-Time Anomalies
To ensure proper device behavior, the rise time of a CAN signal must be inspected. However, a single rise-time or fall-time measurement will not suffice. Statistically, a sample population of more than 1,000 corresponds to a �3-sigma measurement confidence, and a sample population of 10,000 equates to more than �3.5-sigma measurement confidence.
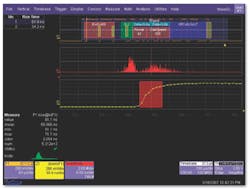
In Figure 1, using all-instance measurements of rise time, the green histicon (iconic histogram) shows a statistically significant rise-time measurement population of more than 5,312, corresponding to greater than �3-sigma confidence. The accumulation of measurements indicates a mean value of 56.966 ns and a standard deviation of 2.054 ns. Minimum and maximum rise-times values of 51.1 ns and 71.7 ns are anomalies forming the extrema at the 3-sigma tails of the histogram.
Within each acquisition, waveform scanning has been enabled to capture the two rarest rise-time values from each acquisition. Of the 5,312 measurements accumulated in the measurement histicon, waveform scanning has identified 746 transitions which meet the user-defined measurement criteria for CAN bus edge transitions.
All values that meet the scanning criteria have been logged into the red histogram. This technique also can be used to verify CAN bus falling-edge compliance by substituting fall time in place of rise time in the scan criteria.
The histogram distribution can quickly identify modulation characteristics. The green histogram shows the accumulation of all rise-time measurements, and the distribution is approximately Gaussian. However, it contains rise-time outliers biased heavily to the right of the mean value due to slow edge rates having low statistical probability. This could be due to a specific CAN node with a low load percentage transmitting slow rise times onto the bus or a group of nodes whose rise times are intermittently slow.
The Gaussian portion of the histogram distribution contains one main mode with rise-time values clustered around the mean and randomly distributed out to the tails. The shape of this distribution indicates random noise within the rise-time measurement, which is due to broadband electrical noise generated by every electrical circuit. By contrast, the red histogram shown in the center grid has two main modes in the histogram or a bimodal distribution.
The rise-time measurements are clustered around two central values and randomly distributed around these modes. The lack of data in this range between the peaks is a function of the user-defined criteria for sorting rise times based on the rarest events.
In this case, the two most recent rise-time anomalies are listed in a tabular index in the upper-left edge of the display. These values correspond to the two red areas highlighted in the F1 differential CAN waveform trace. Clicking on any of the index numbers will highlight that specific rise-time violation in bright yellow.
In addition, the Z1 zoom trace corresponds to the selected rise-time anomaly. Waveform data is automatically saved each time an anomaly is detected. Unlike triggering, waveform scanning will identify not one but all anomalies within the acquisition window. In fact, the trigger can occur anywhere within the waveform since this technique is independent of trigger position.
Edge Detection of Serial Data Transitions
An important switching characteristic of an automotive serial data signal is its linearity in transition. Detection of nonmonotonicity is performed automatically to examine each transition edge using waveform-scanning techniques.
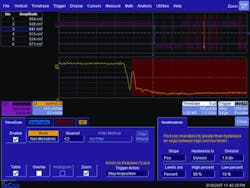
Shown in Figure 2, nonmonotonic mode has been selected and applied to the differential input waveform trace. The scope has detected a considerable ringback in the acquired SPI waveform and highlighted this in red within
the graticule.
Nonmonotonicities such as this could easily lead to logical errors within the system because the ringback portion of the waveform has exceeded the decision threshold and could be detected as a logic-one level by the receiver. Hysteresis can be used to ensure the minimum distance that the edge must traverse to be considered for nonmonotonicity to avoid false detection of signals containing large noise levels.
The scan overlay mode allows for waveform features meeting user-defined criteria to be shown in a persistent display. This is not a persistence display of all acquired waveforms: The overlaid pulses need not occur from separate acquisitions.
Adjacent pulses from within the same single waveform acquisition can be shown in an overlaid display, provided that they meet the user-defined criteria for scan identification. But, not all waveforms will contribute anomalies to the scan overlay. For example, each nonmonotonic edge acquired on the SPI signal could have been overlaid to show a persistence mapping of only those edges that meet the nonmonotonic definition requirements.
Parameter Tracking Identifing Anomalies
When applying a mathematical tracking function to a set of measurement parameter values, a new waveform is constructed that plots parameter values as a function of time position. Unlike an acquired waveform, this new track waveform has measurement parameter values, not voltage, as its Y-axis.
The X-axis of the track waveform shares the same X-axis time scaling as the acquired pulse stream. For instance, a track of duty cycle will be plotted as a function of time. As duty cycle changes slowly over time, the shape and timing characteristics of the track reveal important information not visually available from the input waveform itself.
A CAN message embeds encoded data values in each byte field within the message. Parameters such as engine temperature, wheel speed, and steering angle can be encoded into a CAN message and output at regular intervals by the CAN nodes connected to the bus from each of these functional areas.
Other devices connected to the CAN bus also can read and use these transmitted data values. For example, modern audio systems adjust radio volume level proportional to engine rpm to provide a consistent ambient audio sound level in the presence of changes in automotive background noise. It would be useful in debugging automotive signaling to be able to view the changes in data values that take place relative to the timing of the CAN bus message and relative to other data values concurrently transmitted on the
CAN bus.
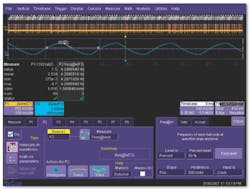
In Figure 3, the orange trace F1 is the differential CAN signal. With a large time capture of 100 ms/division (1 s of acquisition time acquired at 5 MS/s), 99 decoded CAN messages are displayed in the upper grid.
Of a Decoded Data Value vs. Time
A CAN parameter, CAN-to-Value, is enabled in parameter P1, which has extracted and decoded each data byte within each of the 99 CAN messages. The result of P1 is tracked using mathematical operator F3 to display a time-correlated track of each decoded CAN value as a function of time. The same time axis is shared by the differential CAN signal and the track of decoded CAN values. This track shows the instantaneous values on the CAN bus encoded within the message, such as engine speed, brake pressure, or airbag status.
We can see an oscillation forming in the decoded steering-angle CAN values within this large acquisition window. Measurement parameters and mathematical operators can be chained together to form advanced processing chains for automotive signaling analysis.
In this case, the frequency measurement parameter is applied to the track math operator plotting the CAN-to-Value parameter. This parameter is decoding the data contained within the mathematical difference of the high and low CAN input channels. In this case, the chain of math and measurements is five levels deep, and the result is the capability to measure macro effects, such as the frequency of oscillation of the data decoded within the CAN message stream.
In addition, short-term fluctuations are immediately revealed because they will appear as a large spike on the track. Each track can be applied to messages with matching ID values. As a result, measurements could be used to compare two sets of decoded CAN messages.
Beyond quantitative results, measurements on the track also help the user understand the automotive system�s interactional response. For instance, the skew measurement parameter could be applied to determine the timing difference between the wheel speed of the left front wheel and the wheel speed of the right rear wheel with statistics outlining the mean and range.
Analog control signals found in automotive systems often either stimulate or respond to changes in encoded data traffic. The timing between these analog control signals and data signals can be measured to determine timing budgets and margin analysis. In each of these cases, waveform-scanning techniques can automatically monitor for any of these conditions and perform user-defined actions when they occur.
Another important area of consideration is the overall bus utilization. The load percentage of an automotive serial data signal can be calculated based on the message ID, providing quantitative usage analysis of specific nodes on the bus.
Let�s look at the instantaneous value of coolant pressure transmitted onto the bus. The load percentage of messages as a ratio of acquisition time can be computed, for example, showing that coolant pressure messages used 3% of the total time on the bus. The selection could be further narrowed by calculating bus utilization of only those coolant messages with data values above 8.5 kiloTorr.
By performing a track of the load percentage and plotting load percentage as a function of time, this would allow for applied measurement parameters to monitor the interval of time corresponding to anomalous automotive circuit behavior. Waveform scanning could guarantee that the coolant pressure only remained above 10 kiloTorr for no more than 500 ms by monitoring the pulse width of the track of coolant pressure and flagging the occurrence of any widths outside of the range.
In this case, the multileveled math and measurement output chain are measured and monitored as pulse width. This technique can reduce complex system interactions to a single parameter measurement.
Summary
Waveform scanning makes debugging a circuit fast and efficient. Automatic scans can monitor for changes in parametric values such as drifts in frequency, widths that are too narrow, nonmonotonic edges, rise-time anomalies, intermittent events, variation in encoded CAN message data, and many other phenomena.
When operating on a deep acquisition record with a large number of events, waveform scanning quickly locates and identifies anomalies. When operating on multiple acquisitions, the tool continuously scans and executes actions based on user-defined criteria. When an automotive signaling challenge is described in terms of a timing measurement, this technique will rapidly find anomalous conditions.
Measurement filtering methods are available to further narrow the search criteria. The capability to view histogrammed and overlaid measurement and data values provides further analysis of the anomalies identified by the scan.
About the Author
Mike Hertz has been a field applications engineer with LeCroy in Michigan for more than six years. Before joining LeCroy, he was an applications engineer with Agilent Technologies and Hewlett-Packard. Mr. Hertz, who has three U.S. patents pending in the area of oscilloscope measurement design, received a B.S.E.E. from Iowa State University and an M.S.E.E. from the University of Arizona. LeCroy, 700 Chestnut Ridge Rd., Chestnut Ridge, NY 10977, 586-677-7564, e-mail: [email protected]
FOR MORE INFORMATION
on waveform scanning tools
www.rsleads.com/707ee-195
July 2007


