Of course, long before large-scale or wide-spread domestic terrestrial installations, satellites used solar panels for electrical power. Different requirements for reliability, size, and cost are obvious distinctions of space applications as well as special needs such as resistance to cosmic rays. GaAs cells have high efficiency and are resistant to cosmic ray damage so are favored for satellite and spacecraft applications. However, at present they’re too expensive for general use.
The majority of photovoltaic solar cells are made from silicon. Monocrystalline and polycrystalline silicon cells have lower efficiencies than GaAs but are significantly lower cost. Amorphous silicon cells cost even less because processing is similar to screen printing, but efficiency also is lower. Nevertheless, the current produced by all types of solar cells results from the electron-hole pairs freed by solar radiation.
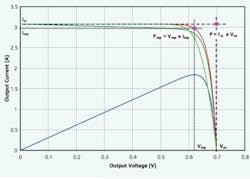
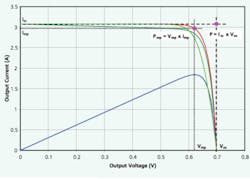
The red curve in Figure 1 is an ideal characteristic curve for a hypothetical solar cell relating output current and voltage. Panels are arrays of electrically interconnected cells. Virtually all useful panels have a similar curve shape, but the performance of each type of material and construction will differ somewhat. The blue curve is a plot of the available output power, peaking at the Imp x Vmp output combination corresponding to maximum power Pmp.Figure 1. Solar Cell Characteristic I-V Curve
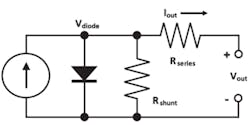
Figure 2 shows the typical equivalent circuit of a solar cell. The current source produces a fixed amount of current given constant lighting conditions and temperature. The P-N junction diode conducts in the direction shown and is part of the nonlinear load seen by the current source.
Figure 2. Solar Cell Equivalent DC Circuit
Figure 1 shows how the voltage and current are related as different amounts of current are drawn from the cell. Because of the diode’s exponential current and voltage relationship, a reasonable amount of current can be drawn from the cell before the voltage drops appreciably. Of course, as the output current increases, the series resistance will cause an additional drop in output voltage as shown by the light green curve. The diode current is further decreased by a small current through the shunt resistance as shown by the dark green curve.
At the maximum open-circuit voltage Voc, no current is output from the cell, and all the generated current flows through the diode and shunt R. At the maximum short-circuit current Isc, almost all the generated current is going through the series R and very little through the diode and shunt R. Because the ideal current source has perfect compliance, the diode anode adjusts to whatever voltage corresponds to the current division at that node. The output current is equal to the current through the series R, which is equal to Isc less that shunted by the diode in parallel with the shunt R.
Both resistances represent losses, so in the ideal case, the series R should be zero ? and the shunt R infinite—the red curve in Figure 1. According to a Keithley Instruments application note, “The series resistance is due to the resistance of the metal contacts, ohmic losses in the front surface of the cell, impurity concentrations, and junction depth…. The shunt resistance represents the loss due to surface leakage along the edge of the cell or to crystal defects.”1
The ratio between a panel’s maximum output power and the theoretical power resulting from multiplying the open-circuit voltage and short-circuit current is called the fill factor. The two products are shown as pink dots in Figure 1. The fill factor is a measure of efficiency to the extent that a small series R and large shunt R will make a panel’s characteristic curve more nearly square and the fill factor closer to 1.0.
Solar cell efficiency is defined as the ratio of the cell output power divided by the total radiant power illuminating the cell. Obviously, this is an important indicator of how well a panel may perform in less than very bright sun light. Depending on what is causing the low efficiency, the characteristic curve may simply shift downward relative to a more efficient cell, indicating less current output under the same lighting conditions. Alternatively, if a small shunt R or large series R is the cause, the curve will be skewed to resemble the green curves in Figure 1. Either of these effects also lowers the fill factor.
Because a solar cell’s operation is described by a transcendental equation, no analytic solution is possible directly in terms of the output voltage and current. Instead, Figure 1 is an X-Y plot of the output I-V pairs that result as the diode voltage is stepped through a range of values.
Solar Simulation
During system development, one way to generate realistic input power is to use the actual solar array with artificial lighting. For this purpose, special solar simulators are made with carefully controlled spectral properties and variable intensity. If a system is reasonably compact, this may be a good solution.
Satellite applications can be very difficult to test for a number of reasons. Satellites are stabilized by spinning them at speeds from a few revolutions/min up to about one revolution/s. This means that solar cells on one side are exposed to light and heat up as they supply current while those on the other side are in the dark and cooling down. Cyclical illumination and heating/cooling are inherent in this kind of application, and the power system design has to take these factors into account.
So too must power system testing. An article that appeared in LXI ConneXion discussed the details of a satellite temperature test required by the China Academy of Space Technology in which 240 heater control zones were established within a large vacuum chamber. Halogen-type heater elements were used, and the power supplies that drove them needed to have a 100-ms response time.
As the article explained, “A test chamber used for environmental testing of a satellite must subject it to the same conditions encountered in space. This requires the use of a vacuum chamber that also can, under programmatic control, heat and cool the satellite.”2
There’s no question that an actual panel operated with controlled illumination and temperature generates the most realistic output conditions. On the other hand, this kind of test setup can be unwieldy and expensive if one or more large panels are involved. A Newport product-training document contains a great deal of practical information related to solar simulation. In particular, it highlights the need to match the desired solar spectral component power, not just the overall irradiance level.3
Solar Panel Simulation
A solar array simulator (SAS) is a special-purpose power supply that can emulate a solar panel’s I-V output characteristics. Typically, these instruments are similar in size to a conventional power supply so they facilitate compact and economical test setups. However, the nonlinear I-V output follows the red or green curves in Figure 1 rather than providing a constant voltage or constant current as is usual in a power supply.
The greatest AC power output from the overall solar power system usually results when the inverter receives the highest output power from the panel. For this reason, inverters have a variable input impedance controlled by a very clever peak-power monitoring algorithm. The goal is to continuously track the maximum power point (MPP) on the solar-panel characteristic curve regardless of changes in light intensity or temperature. Maximum power transfer occurs when the inverter input impedance exactly matches the solar panel output resistance at the MPP.
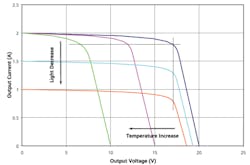
This is important because, as Figure 3 shows, the MPP changes significantly with both light intensity and temperature. In an actual solar panel, these relationships are satisfied as fast as the electrons flow: If you draw a certain current from a solar cell, it comes with a corresponding voltage.
Figure 3 was developed from equations presented in an Agilent Technologies application note but credited to a European Space Power Conference paper.4 In contrast to the basic circuit equations associated with Figure 2, these equations explicitly include Imp and Vmp at the MPP as well as Vocsc. In this method, the series R and shunt R are derived quantities rather than inputs. If you had measured data from a cell or panel, these equations would allow you to plot representative characteristic curves. and I
An SAS doesn’t inherently have a cell’s I-V characteristics so it must generate the correct values on demand. Usually, this is done with a look-up list and a fast control loop. The measured current indexes a location in a voltage look-up table that then is output. A simulator’s I-V characteristic must keep up with an inverter’s peak-searching algorithm.Speed also is important in satellite applications. An Agilent application note describes sequential shunt regulation used to regulate satellite battery charging. In this technique, separate sections of the overall solar panel array are dynamically connected in parallel to meet load current demand. The discussion relates to the company’s SAS Model 436xA, “To satisfy the demands of the satellite power system, the output voltage of the SAS has to rise within about 1 µs to 10 µs when the shunt is opened and the operating point changes from the Isc to the operating point on the [characteristic] curve.”5
Agilent’s Noah Schmitz, business development manager, solar simulation, explained, “There are three main characteristics that distinguish an SAS from a battery simulator or power supply. Power level is one, with most battery simulation applications being low power such as hand-held portable communications devices. Agilent and Keithley [Instruments] battery simulation power supplies provide output power in the range of tens of watts. Most solar simulation applications, in contrast, require much greater power—hundreds of watts for microinverters, kilowatts for satellites, and megawatts for solar farms. Agilent SAS instruments provide kilowatt-level output power.
“A second difference,” he continued, “is output capacitance. If a solar cell is shaded, its output drops almost instantaneously. Most Agilent SAS modules have an output capacitance less than 50 nF, a thousand times less than a general-purpose power supply. The third difference is generation of I-V values according to a prescribed characteristic curve.”
Agilent’s E4360 family of SASs operates in three ways. An internal algorithm can generate a 4,096-point I-V table corresponding to a curve defined by Voc, Isc, Imp, and Vmp. Alternatively, you can input a table of three to 4,000 I-V pairs. Voltage and current offsets can be specified to simulate lighting or temperature changes as shown in Figure 3. Finally, there is a fixed-mode equivalent to the I-V characteristics of a standard power supply.
Kepco’s Model KLP-S-Series Solar Emulators are based on existing KLP-Series power supply technology and can be operated as a normal 1,200-W supply with hyperbolic power limit. When used with a proprietary LabVIEW driver, the emulator output follows a table of I-V pairs based on Voc, Isc, Imp and Vmp values.
The company’s Sales and Marketing Vice President Saul Kupferberg commented, “Fast response is required of a solar array simulator. A battery simulator has a response on the order of 0.1 s while a solar simulator must be several orders of magnitude faster. This is achieved in the KLP-S Solar Emulator by having a loop response that is much faster than a normal power supply response.
“Some of Kepco’s customers use the KLP-S Series to simulate a panel’s response to sunrise-to-sunset curves with varying cloud cover and varying solar azimuth angles for different latitudes and times of the year,” he concluded. “The requirement is for fast curve-to-curve change rates, typically less than 100 ms.”
Magna-Power Electronics also has developed software that programs the company’s power supplies to follow a characteristic solar array I-V curve. Depending on the series power supply used, output power from 2 kW to more than 900 kW is available.
The required profile can be developed directly from user-provided Voc, Isc, Imp, and Vmp values or from a separate list of up to 50 I-V pairs. The output sampling rate is quoted as 5 ms.
Ametek’s Elgar SAS system is based on 500-W or 1,000-W fast profiling current source (FPCS) modules and can be as large as 128 channels with a total output power of 57.6 kW. As described by the datasheet: “With a bandwidth greater than 500 kHz, the FPCS is unconditionally stable at any point of the I-V curve. It can operate continuously at the MPP of the output curve into a sequential shunt unit or into any other power system output topology.
“Since the FPCS is capable of a smooth transition from one calculated curve to another without any output disturbances, varying insolation patterns can easily be simulated. With a maximum curve update rate of 4 times/s, entire orbits can easily be simulated with fine time resolution.” Insolation (incident solar radiation) is a measure of average irradiance expressed in W/m2 or kW/m2/day.
Summary
Photovoltaic solar array power generation isn’t new, but the growth in terrestrial installations certainly is. Through a combination of technological improvements, private investment, and government support, large-scale solar power farms have been built with many megawatts of output capacity.
Satellite and spacecraft applications have continued but can’t compare in volume to the large alternative power installations. Nevertheless, both types of applications require careful design and testing to ensure maximum performance.
SASs greatly simplify the design of power systems by eliminating the variability associated with real solar panels under actual environmental conditions. For arrays located in sun-drenched open areas, close adherence to the characteristic I-V curve may be a prime SAS requirement, response speed being secondary. Satellite power system testing clearly requires good performance in both areas.
SASs are available that very closely emulate solar panel properties. Their use maximizes the correlation between test results and actual performance.
References
| FOR MORE INFORMATION | Click below | |
| Agilent Technologies | SAS Solar Array System |
Click here |
| Ametek | Elgar SAS |
Click here |
| Kepco | Model KLP-S Solar Emulator |
Click here |
| Magna-Power Electronics |
Photovoltaic Power Profile Emulation Software |
Click here |
| Newport | Sol3A Class AAA Solar Simulator |
Click here |
May 2010
{jcomments on}


