Electricity from sunlight is truly green and inexpensive but requires an energy conversion system with photovoltaic (PV) cells and a storage unit such as a battery. PV or solar cells are finding increasing use in outdoor lighting schemes and even for full-house and industrial applications.
A solar cell’s function is simple: absorb photons from sunlight and release electrons. When a load is connected to the cell, electric current will flow.
To characterize the electrical properties of PV cells and materials, many electrical measurements are performed. These tests can be conducted during research and development on the cells or as part of the manufacturing process of the cells. These tests may include current vs. voltage (I-V), capacitance vs. voltage (C-V), capacitance vs. frequency (C-f), and pulsed I-V. From these electrical tests, many common parameters can be extracted, such as the output current, maximum output power, doping density, conversion efficiency, resistivity, and Hall voltage.1
PV cells are based on a variety of light-absorbing materials, including crystalline and amorphous silicon, thin films such as cadmium telluride (CdTe) and copper indium gallium selenide (CIGS) materials, and organic/polymer-based materials.
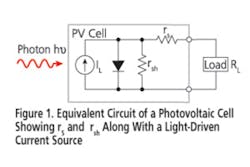
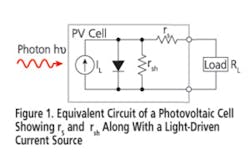
Because of material defects and ohmic losses in the cell substrate material as well as in its metal conductors and contacts, the PV cell model also must include series resistance (rs) and shunt resistance (rsh), respectively, to account for these losses. rs is a key parameter because it limits the maximum available power (Pmax) and the short-circuit current (Isc) of the PV cell.
The rs of the PV cell may be due to the resistance of the metal contacts on the cell, ohmic losses in the front surface of the cell, impurity concentrations, or junction depth. Under ideal conditions, rs would be 0 ?. The rsh represents the loss due to surface leakage along the edge of the cell or crystal defects. Under ideal conditions, it would have an infinite value.
DC Current-Voltage Measurements
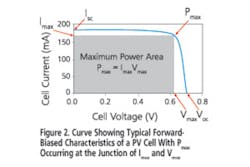
PV cells can be evaluated by means of DC current-voltage (I-V) plots that typically show the current produced by a solar cell as a function of the voltage (Figure 2). The Pmax available from a cell is shown at the point of maximum current (Imax) and voltage (Vmax); and the area under the curve represents the maximum output power capability of a cell at different voltages.
The measurement system should allow for a four-wire measurement to be made. Using a four-wire technique eliminates the lead resistance from affecting the measurement accuracy. For example, one pair of test leads may be used to source voltage and the second pair of leads to measure the current flowing from the cell. It is very important to place the test leads as close as possible to the cell.
Other data that can be derived from the DC I-V plot of a PV cell characterizes its overall efficiency or how well it transforms light into electricity. It can be defined by a number of parameters, including its energy conversion efficiency, maximum power capability, and fill factor (FF). The maximum power point is the product of the maximum cell current and voltage where the power output of the cell is greatest.
The FF compares a PV cell’s I-V characteristics to those of an ideal cell. Ideally, it would have a value of one, but in practical PV cells, it always is less than one. The fill factor is defined as
I-V measurements of a PV cell can be performed under forward-biased (in the light) or reverse-biased (in the dark) conditions. Forward-bias measurements are conducted under controlled illumination of the PV cell with the light energy representing the input power to the cell.
The cell also is swept through a range of applied voltages, and the resulting current from the cell is measured. Typically, the voltage applied to the PV cell might be swept from 0 V to the Voc for that cell. At 0 V, the current is expected to equal the value of the Isc. When the voltage is set at Voc, the current should be zero. In the model of Figure 1, Isc is approximately equal to the load current (IL).
The rs of a PV cell can be determined from at least two forward-biased I-V curves measured at different light intensities. The magnitudes of the light intensities are not important because it is the change in voltage with the change of current, or slope of the curve, that is meaningful in all cases.
Bearing in mind that the slope of the curve changes dramatically from beginning to end, meaningful data can be found at the curve’s far-forward region where the curve starts to take on linear characteristics. The inverse of the change in current as a function of voltage at this point gives the value for rs
rs = ?V/?I
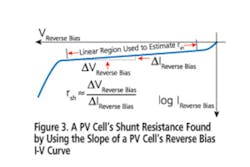
The measurements discussed so far have been made with a PV cell exposed to light-generating output power under forward-biased conditions. But some of the characteristics of a PV device, such as rsh and leakage current, are best found with the PV cell shielded from light and operating under reverse-biased conditions.
rsh = ?V Reverse Bias /?I Reverse Bias
In addition to making these measurements in the absence of any light sources, the PV cell also should be properly shielded and low-noise cables used in the test setup.
Capacitance Measurements
Like I-V measurements, capacitance measurements can serve to characterize a solar cell. The capacitance can be measured as a function of the DC voltage, frequency, time, or AC voltage depending on what parameters of a cell need to be determined.
For example, measuring the capacitance of a PV cell as a function of voltage can help when studying the doping concentration of the cell or the built-in voltage of the junction. A capacitance-frequency sweep provides information about charge traps in the PV substrate’s depletion region. The capacitance of the cell is directly related to the area of the device so devices with large areas will present large capacitances to the measurement setup.
C-V measurements require that the capacitance of the cell be measured as a function of an applied DC voltage. Like I-V measurements, the capacitance measurements are made using a four-wire technique to compensate for lead resistance. The four-wire connections should be maintained to the cell. The test setup should include shielded coaxial cables with the shields connected as close as possible to the PV cell to minimize errors from the cables.
Calibration techniques based on measuring open and short circuits will reduce the effects of cable capacitance on measurement accuracy. C-V measurements can be made under either forward- or reverse-biased conditions.
Another capacitance-based measurement, drive level capacitance profiling (DLCP), can be used to determine the defect density of a PV cell as a function of depth on some thin-film solar cells such as CIGS. The measurement involves applying a swept peak-to-peak AC voltage and varying the DC voltage while making capacitance measurements. The two voltages must be adjusted so the total applied voltage (AC + DC) remains constant even as the AC voltage is swept. By doing this, the exposed charge density within the material will remain constant for a given location, making it possible to determine the defect density as a function of distance.2
Resistivity and Hall Voltage Measurements
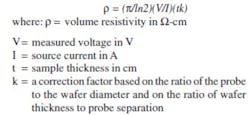
The resistivity of the PV cell material can be determined by sourcing current and measuring voltage using a four-probe approach,3 either the four-point collinear probe technique or the van der Pauw method.
For making measurements using a four-point collinear probe, two probes are used to connect the current source and two probes to measure the voltage drop across the photovoltaic material. When the thickness of the PV material is known, the volume resistivity (?) can be calculated as
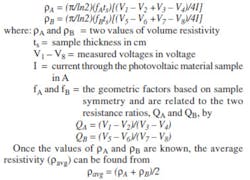
The van der Pauw method involves applying a current and measuring the resulting voltage using four small contacts on the circumference of a flat, arbitrarily shaped PV material sample of uniform thickness. The spacing of the four probes is not critical, making this approach useful for small samples where the probes can’t be evenly placed.
Eight voltage measurements are required in the van der Pauw resistivity measurement method. The measurements V1 through V8 are made around the periphery of the material sample.
Two values of resistivity then are found from the eight measurements according to
Errors in high resistivity measurements can arise from a number of sources, including electrostatic interference, leakage current, temperature, and carrier injection. Electrostatic interference occurs when an electrically charged object is brought near the sample. To minimize these effects, the sample should be properly shielded to avoid external charges. The shield should be properly grounded by connecting it to the low terminal of the measuring instrument.
Low-noise shielded cables also should be used in the voltage measurements. Leakage current can degrade the measurement accuracy on high resistance samples. The leakage current is due to the cables, probes, and test fixtures and can be minimized by using high-quality insulators and enabling guarded measurements including the use of triax cables.
Pulsed I-V Measurements
Pulsed I-V measurements may be useful for deriving parameters of a solar cell. In particular, pulsed I-V measurements can determine the conversion efficiency, minimum carrier lifetime, and the effects of cell capacitance.
The PV measurements can be made quickly and simply by using an automated test system designed for evaluating semiconductors, such as the Model 4200-SCS Semiconductor Characterization System from Keithley Instruments.4 The system can source and sink current using a four-probe approach and make software-controlled measurements of current, voltage, and capacitance. It can be outfitted with a variety of source and measurement modules to make continuous and pulsed I-V and C-V measurements for deriving important PV cell parameters.
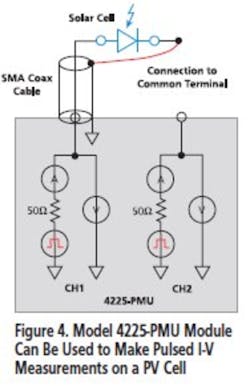
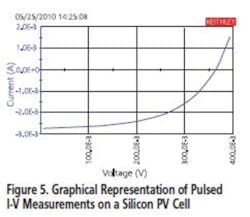
For example, the system can be connected to a PV cell to perform a pulsed I-V sweep using a Model 4225-PMU Module (Figure 4).5 In addition to sourcing a pulsed voltage, the PMU can sink current so it can measure a solar cell’s output current as shown in Figure 5.
References
1. Making I-V and C-V Measurements on Solar/Photovoltaic Cells Using the Model 4200-SCS Semiconductor Characterization System, Keithley Instruments, Application Note 2876.
2. Heath, J.T., Cohen, J.D., and Shafarman, W.N., “Bulk and metastable defects in CuIn1-XGaXSe2 thin films using drive-level capacitance profiling,” Journal of Applied Physics, 95, 1000, 2004.
3. Four-Probe Resistivity and Hall Voltage Measurements With the Model 4200-SCS, Keithley Instruments, Application Note 2475.
4. Electrical Characterization of Photovoltaic Materials and Solar Cells With the Model 4200-SCS Semiconductor Characterization System, Keithley Instruments, Application Note 3026.
5. Ultra-Fast I-V Applications for the Model 4225-PMU Ultra-Fast I-V Module, Keithley Instruments, e-book.
About the Author
Mary Anne Tupta is a senior applications engineer at Keithley Instruments. She earned a B.S. in physics/electronic engineering and an M.S. in physics from John Carroll University and has assisted Keithley customers with instrument applications since 1988. Keithley Instruments, 440-498-2715, e-mail: [email protected]
