Environmental testing simulates the conditions likely to affect operation of a UUT in its intended application. Sometimes, the effectiveness of a test is directly related to the fidelity of the simulation. For example, if a resonance exists at 500 Hz but vibration testing doesn’t stimulate the UUT at this frequency, the test results will be misleading. In other cases, the basic test setup is dictated by the physics of the DUT.
Flame Arrestor Testing
This is true for flame arrestor testing. The purpose of a flame arrestor is to stop a flame from propagating. Typically, flame arrestors are passive devices mounted in a run of pipe or at the end. They operate by lowering the temperature of a flammable air/fuel mixture to below that needed for ignition. There also is a minimum size gap that a flame requires for propagation, and many flame arrestors use fine metal mesh or corrugated strips to minimize the gap size as well as absorb heat.
Sheldon Levine, vice president of marketing and business development at AERO NAV Laboratories, described recent flame arrestor testing the company had performed: “Flame arrestors typically are used in fuel systems, pipelines, ducts, and vents where they provide protection against flames, lightning strikes, and other possible sources of ignition. They serve to prevent flames from entering or leaving lines or vessels. When testing flame arrestors, portions of the system installation must be replicated to validate the effects that pipeline components may have on the arrestor performance.”
Flame arrestors are commonly constructed of fine metallic conductors installed within tubular members that serve to absorb heat from the flame front, lowering the temperature below the ignition point, and then dissipating it harmlessly through the housing to the atmosphere. They perform a secondary but important function of retarding the flame front so that the flame consumes the oxygen available within the line faster than it can be replenished.
A flame may progress through several stages if confined inside a pipe full of a flammable air/fuel mixture. After ignition, the flame front will travel at an ever-increasing rate toward the unburned gas supply. Pressure increases, more heat is generated, and the flame front progresses faster until the gas explodes. Of course, if the pipe is not ruptured, the explosion simply causes an even greater pressure increase and further accelerates the flame front to hypersonic speed.1
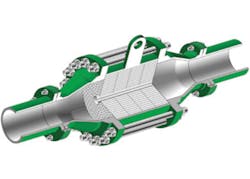
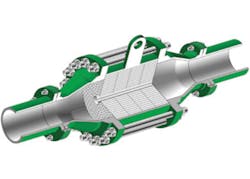
Figure 1. Detonation-Proof Flame Arrestor
Cutaway View
Courtesy of ENARDO
The purpose of a flame arrestor is to avoid this situation by stopping the flame from propagating. However, the arrestor design depends on the particular application. For example, an arrestor used ahead of a flare could be required to stop flame propagation any time the gas flow rate decreased to less than the so-called burn-back velocity. This is the rate of gas flow necessary to maintain a stationary flame front. Flow slower than this allows the flame front to propagate back toward the gas source—in this case from the flare toward the arrestor.
If the possibility of an explosion cannot be completely eliminated, then a heavy-duty flame arrestor similar to the one shown in Figure 1 might be appropriate. Not only must it be designed to absorb sufficient heat and have small enough passages to be effective in normal operation, but it also must withstand explosive forces.
“The testing of flame arrestors using an explosion chamber, where the UUT is located outside of the chamber, is an innovative application,” Mr. Levine continued. “Typical explosion testing is performed with the UUT located within the chamber,” he said. “Explosion testing is normally performed to verify that electrical equipment will not generate hot spots, friction, arcing, or sparks during operation that may ignite an explosive air/fuel mixture.
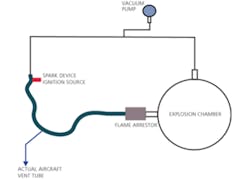
Figure 2. Flame Arrestor Test Setup
Courtesy of AERO NAV Laboratories
“Figure 2 presents the elements of a test setup for a flame arrestor and an aircraft fuel tank vent line,” the AERO NAV officer explained. “The chamber serves as the source of the flammable air/fuel gaseous mixture that simulates the fuel tank atmosphere. The vent line is configured to represent the actual line installed on the aircraft. The first step is to generate an air/fuel gaseous mixture in the chamber. The vacuum pump is then used to move a portion of the mixture from the chamber and circulate it throughout the system. A spark provides the source of ignition that consequently develops a flame front. The flame front travels through the vent line toward the arrestor where the flame is prevented from entering the main chamber.
“As a verification of the effect of the arrestor, it is then removed from the line, and the test sequence is repeated. The flame front travels from the ignition source to the main chamber. An audible explosion within the chamber is proof that the arrestor was effective in stopping the propagation of the flame and the subsequent explosion,” Mr. Levine concluded.
It’s important that the actual aircraft vent tube was correctly represented and used together with the flame arrestor UUT. The ratio of vent tube length to diameter directly affects the flame front speed and gas pressure that will exist some distance from the ignition source. These factors, in turn, constrain selection of a suitable flame arrestor. The test really is proving the effectiveness of the flame arrestor when used in this application—it’s a system test, not simply a component test.
Vibration Test
Comparative Test Methods
In a totally separate application, Quanta Laboratories was called upon by Huawei, China’s largest telecommunications company, to help improve its product reliability. A HALT study was performed that compared the pneumatic hammer repetitive shock (RS) methodology to the electro-dynamic (ED) shaker with skewed fixture vibration technology.
When Huawei experienced field failures on its products and could not duplicate the failures by conducting HALT tests on the RS system, the company repeated the HALT tests on an ED shaker with skewed fixture environmental stress screening (ESS) system. Most of the vibration-related defects were found in a much shorter test time and at significantly lower vibration intensity levels.
Dr. Hong-sun Liu, president of Quanta Labs, explained the problem in more detail, “After testing several hours of HALT on an RS system for up to 40 g rms vibration, Huawei’s engineering team could not duplicate the vibration-related problems in the Quidway NE Router that had been seen in the field. The team used Quanta’s ED shaker with skewed fixture to perform HALT and duplicated all the problems found in the field at vibration levels of 5.0 and 7.5 g rms in just a few minutes. Because of this encouraging result, a series of tests was conducted to further evaluate the effectiveness of both ESS systems.”
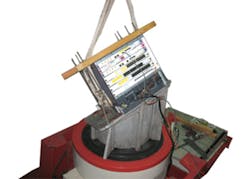
Figure 3. Huawei Network Blades on
Skewed ED Shaker
Courtesy of Huawei and Quanta Laboratories
HALT was performed on a total of eight blades, three different types of network blades, on both the RS system and ED shaker with skewed fixture shown in Figure 3. Since the main difference between these two systems is in the vibration inputs to the test articles and in order not to introduce another stress factor, only vibration was used for these tests with no temperature cycles imposed on them. Table 1 summarizes the test results.
For the three different blades, the RS system found five problems, two of which were related to actual failures. The ED shaker with skewed fixture identified a total of 30, including all those found by the RS system. Of the 30 problems found, 21 were identified as actual field failures. Most vibration-caused field failures were successfully duplicated by the ED shaker with skewed fixture.
“For all three blades tested, the results showed that the ED shaker with skewed fixture was capable of finding problems at much lower g rms levels and in a much shorter time than the RS system,” Dr. Liu explained. “It also identified more product weaknesses. Similar results also were found in other products.
Table 1. Huawei Test Results Summary
Source: Huawei and Quanta Laboratories
“While the ED shaker with skewed fixture uncovered six times more problems, the more impressive correlation is that the ED shaker with skewed fixture identified 21 field failures vs. only two for the RS system. This study has shown that the ED shaker with skewed fixture seems to be more effective than the RS system for screening product weaknesses. More importantly, the problems found by the ED shaker with skewed fixture have a higher correlation with field failures. This will allow Huawei to better utilize its time and resources to fix real field failures,” Dr. Liu concluded.
Fatigue and Vibration Spectra
Although it’s not possible to say for certain why there was such a difference between the RS and ED shaker test results, there are many technical papers that compare the two types of vibration environments. In general, the results were different because the two test methods were not simulating important aspects of the actual use conditions in the same way.
An article written by George Henderson examined ways in which an RS machine could be used to replicate the acceleration loading of a UUT end-use environment.2 For an ED shaker, this is straightforward because the spectrum is controllable. For an RS machine, it is not. Just setting an RS machine to produce a desired g rms level doesn’t correlate directly with the power spectral density (PSD) value at a particular frequency.
Because the spectrum is uncontrolled and because the PSD and g rms vary at different locations on the machine table, some frequencies typically are over-tested and some under-tested. Henderson discussed the damage potential spectrum DP(f) and made the point that fatigue damage results from stress loading for a period of time, not directly from the PSD. DP(f) is based on velocity because “stress that produces fatigue is directly related to vibration modal velocity, not to acceleration,” he said.
In an experiment to prove the concept, the DP(f) metric was applied to actual diesel engine vibration data as well as to an RS machine. Failure of a component on the engine was linked to a narrowband resonance, and it was possible to match the DP(f) plots for the actual engine and RS machine over a small band of frequencies by adjusting the RS machine exposure time.
Simultaneous Test Method
In another example, MET Laboratories was contracted by a leading book accessories manufacturer to perform simultaneous HALT testing on two LED book lights. One light was the manufacturer’s current production version, and the other light was a new China-sourced model made to the same specifications.
Both products were without existing operating and destruct limits data. The tests were used to uncover design and process weaknesses as well as differences between lights by using thermal step stress, vibration step stress, and combined temperature and multi-axis, 6 degree-of-freedom vibration from a RS machine.
MET Laboratories’ Marketing Director Barnaby Wickham described the test setup: “The test chamber was a QualMark Typhoon 2.5. It has a temperature range of +200°C to -100°C with a maximum ramp rate of >60°C/min and a vibration range of 50 g rms from 10 Hz to 5 kHz and 60 g rms from 10 Hz to 1 kHz.
“The two DUTs were secured to an aluminum channel bolted to a vibration table in the chamber,” he continued. “The fixturing was designed to maximize the transmission of energy from the vibration table to the product without restricting airflow. Thermocouples were attached to both DUTs near the LEDs and on the battery case of each using thermally conductive adhesive tape. The DUTs were monitored via visual observation of the LED.
“The DUTs were first subjected to thermal testing: cold thermal step stress, hot thermal step stress, and rapid thermal transitions. The cold thermal step stress began at 20°C and incremented 10°C every five minutes in a pattern that reached -30°C and returned to 20°C. Both LEDs exhibited similar failure behaviors at the lowest temperatures, with the China version failing just ahead of the production version. Both LEDs recovered when the temperature was increased. The hot thermal step stress began at 20°C and incremented 10°C every five minutes in a pattern that reached 130°C and returned to 20°C. Both LEDs began blinking at 90°C with total LED failure at 130°C. Neither LED recovered when the temperature was decreased. Both DUTs displayed melting on the LED and battery cases.
“A new set of DUTs then was subjected to rapid thermal transitions: temperature cycles from -10°C to 70°C at an average thermal transition rate of 45°C/min. No anomalies were observed during this testing.
“The DUTs also were subjected to vibration step stress testing beginning at a setpoint of 5 g rms, increasing in 5-g rms increments at 5-minute intervals. At the initial 5 g rms level, the LEDs of both lights flickered and blinked, then failed. Following DUT replacement and retesting, the same anomalies were witnessed. After investigation, it was determined that the failures were occurring in the battery case. Combined thermal and vibration testing was not performed due to the DUT sensitivity to vibrations.”
Mr. Wickham confirmed that the two products performed in a very similar way, with the minor differences noted. “The results indicate some design issues in the battery case area, but any changes obviously are up to our client based on their objectives. I’m not aware of what design changes they made, if any,” he explained.
Summary
Before any of the three environmental test applications could be addressed, it was very important to understand the objective of the proposed testing. For the flame arrestor, the difference between testing the component and the overall venting system was critical. Flame intensity and speed of movement depend on the diameter and length of the vent tube, so the tube and flame arrestor must be tested together.
Vibration testing seems straightforward, but the objectives of the two examples were not the same. For the LED book lights, the manufacturer wanted assurance that units from a new source were equivalent to his current product. The exact vibration and temperature performance characteristics of the two DUTs weren’t as important as any differences between them.
The telecom vibration testing example highlighted several aspects of vibration testing, the most obvious being the different capabilities of the RS and ED machines. On the other hand, as Henderson’s article explained, it’s not just a shaker’s PSD that determines fatigue damage. Fatigue is related to vibration velocity and exposure time. Perhaps comparing the test data on this basis would help to explain the large difference in the number of faults reproduced.
References
1. “Flame Arrestor Technology,” ENARDO, http://www.enardo.com/pdfs/tech_paper_fat.pdf
2. Henderson, G., “Correlating End-Use Environments and ESS Machine Excitation Using Fatigue Equality, TEST Engineering & Management, August/September 2004.


