Webster defines calibrate as “to standardize (as a measuring instrument) by determining the deviation from a standard so as to ascertain the proper correction factors.” To perform a calibration, you need a reference and an instrument with which to measure deviation.
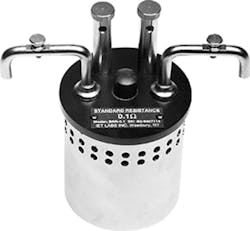
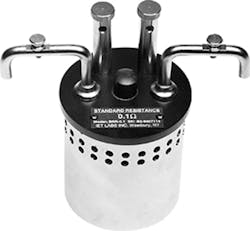
Courtesy of IET Labs
For RF power calibration, a common test method uses a bolometer and a balancing bridge. Bolometers are made from various materials that have a stable and relatively large resistance temperature coefficient. Platinum often is used because of its very wide temperature range and nearly linear change in resistance vs. temperature difference.
These devices can be extremely sensitive. Samuel Langley’s bolometer in the late 1800s could detect the heat from a cow from as far away as one-quarter mile. Langley, the astronomer and physicist for whom NASA’s Langley Research Center is named, needed a way to measure the radiation coming from different parts of the sun’s spectrum because he wanted to understand how the earth’s weather was influenced.1
Typically, a bolometer forms one or more legs of a Wheatstone bridge. Langley’s device used thin strips of blackened platinum, one exposed to the solar radiation and one that was not. The strips formed opposite arms of a Wheatstone bridge. A detailed description of an astronomical bolometer and its use can be found in Reference 2.
Without very stable electronics, high sensitivity was only obtained with great difficulty. For example, a large galvanometer room allowed the minute deflection of a galvanometer mirror to be amplified by reflecting a narrow light beam over a long distance. Langley described a galvanometer he used as having a 9.5-mm diameter mirror with a 1-m radius—the measuring scale was 1 meter from the mirror. He said, “…a deflection of 1 mm on the scale at 1 meter is given by a current of 5E-10 A…. Bolometers were then used in connection with this instrument, such that a deflection of 1 mm corresponded to 1E-5 degree differential change of temperature of the strips.”2
The bolometer element must be well insulated from its surroundings so the small change in temperature caused by changes in incident power lasts long enough to be recorded. Modern semiconductor-based bolometers are constructed using MEMS techniques to suspend the individual elements above the substrate. This achieves thermal isolation to a large degree, the supporting leads being very small and containing a minimum of metal. Bolometers may be sealed in a vacuum to further ensure thermal isolation.
Langley commented that the outer case of his device received a steady supply of mains water to keep it at a constant temperature. To reduce thermal losses, the platinum strips had only the minimum support necessary. Sensitivity in modern devices can be limited by self-generated thermal noise, so many bolometers are cryogenically cooled.
RF Power Measurement
A bolometer in combination with a Wheatstone bridge can be used in two ways to measure RF power. Adam Fleder, president of Tegam, described one of these: the substitution process. “This involves making two precise measurements with the RF power turned on and off. The change in the amount of DC power [to balance the bridge] is used to compute the proportional RF power. This requires monitoring a nominal 2.5-V signal for a change of 40 mV and needs both accuracy and resolution,” he explained. Alternatively, and assuming that the bolometer is linear around a calibration point, variations in RF power can be read directly as deviations from a previously determined level.
Tegam has developed a range of RF power calibration equipment such as the PM Series Microwave Power Calibration System that includes the Model F1135B RF Power Transfer Standard. This temperature-controlled instrument is based on a thermistor bolometer, claimed to provide the lowest drift of absolute power readings. It has a power range from 0.01 to 25 mW for frequencies from 10 MHz to 26.5 GHz.
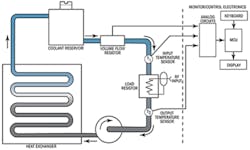
Calorimeters also have been developed to measure RF power and use a similar substitution approach (Figure 1). Rather than radiation impinging on and raising the temperature of a bolometer’s elements, in a calorimeter, RF power is directly dissipated in a load resistance. The resulting temperature rise is the measure of power.
Courtesy of Bird Technologies Group
The RF load is immersed in a thermally isolated bath along with a reference resistance connected to an AC supply and a thermopile to measure the temperature rise. The fluid in the bath is recirculated and kept at a constant temperature except for that flowing from the load and reference resistances to the thermopile. With the RF power off, the AC current is adjusted to provide the same temperature increase at the same fluid flow rate. In some designs, a separate reference resistance is not used; instead, AC or DC current is directly substituted for the RF input to the load resistor.
Tim Holt, director of systems and applications engineering at Bird Technologies Group, commented on RF power measurement accuracy, specifically the company’s continuing development of high power calorimeter techniques, “which provide the most direct path to national standards. While Bird pioneered the application of automatic frequency response correction techniques in our power measurement products, we continue to search for new methods to reduce the overall uncertainty of our RF power calibrations,” he said. “One such method involves the assembly of instrument error budgets that are increasingly comprehensive, including error components such as RF generator stability, mismatch uncertainty, and any uncertainties associated with calibration signal quality.”
The calorimetric approach has the advantage of high accuracy as well as the capability to handle high power with virtually any modulation. Data presented in a Bird white paper confirmed less than ±0.2% error over a one-month period for a particular calorimetric power meter.3
The same white paper also described two factors responsible for the accuracy improvement made to the A series of the company’s 4020 Series Power Sensors. One change from the previous design was to restrict the frequency range. The other was to change the detector scheme so that “the entire dynamic range of the power sensor is contained within the square law operating range of the detector.” This change significantly reduced errors caused by harmonics and amplitude modulation and allowed the sensor accuracy specification to be improved from ±3% to ±1%.
DC Resistance
Resistance is one of the three fundamental electrical quantities and today is defined by the quantum Hall effect (QHE) discovered by Klitzing in February 1980. The voltage associated with the Josephson effect and the QHE resistance have replaced the older artifact-based SI definitions.
Nevertheless, even though the QHE is used throughout the world as the reference for resistance, it’s not as easy to deal with as a traditional standard resistor. Most of these resistors are based on Dr. James L. Thomas’ design, adopted as the U.S. standard of resistance from 1939 until supplanted by the QHE in 1990. Thomas was chief of the Resistance and Reactance Section of the National Bureau of Standards until his retirement in 1962. In a 1948 paper, Thomas discussed precision resistors and their measurement in detail. In particular, he provided information about the materials used and the construction of standard resistors.4
Manganin was developed about 1890 and is an alloy of copper, manganese, and nickel, nominally 84%, 12%, and 4%, respectively. This material is well suited for precision resistors because of its very low temperature coefficient of resistance near room temperature as well as its small offset relative to copper in the thermoelectric series. Thomas noted a difference of 2 or 3 µV/°C in the material’s Seebeck coefficient relative to copper.
In comparison, Constantan is an alloy of the same elements, but in very different proportions, having between 40% and 60% nickel, a small amount of manganese, and the remainder copper. Constantan has a very large 40-µV/°C Seebeck coefficient and often is used in thermocouples: Constantan-Copper (type T) and Constantan-Iron (type J). Other than the large Seebeck coefficient, it has very similar characteristics to manganin, and Thomas noted that sometimes Constantan is used for high value standard resistors, especially for AC applications.
More recently, Isabellenhütte, the German developer of manganin, introduced zeranin®, a family of copper alloys with about 7% manganese and a smaller amount of either tin or germanium. Similar to manganin, this material’s temperature coefficient of resistance has a parabolic shape with its maximum around room temperature, but the curve to several tens of degrees either side of the peak has only about 10% of the slope for manganin.
Thomas identified several effects that had been observed to cause resistance change. Insulation materials in the 1930s and 1940s were not as advanced as those used today, wire being cotton or silk covered and coils impregnated with wax or shellac. In addition, the resistance wire was wound on wooden bobbins. All these natural materials absorbed moisture, and that caused a noticeable difference between values for resistors calibrated during dry periods and those during periods of high humidity.
Most of the problem was caused by the wooden bobbin changing size, which stressed the wire wound around it. For Thomas’ new design, coils were wound on insulated brass bobbins, brass having nearly the same coefficient of expansion as manganin. Thomas noted that after coils were completed but before the terminals were joined, the coils were artificially aged at 150°C for at least 48 hours. However, he carefully distinguished between the use of the term annealing, which implies a much higher temperature, and simply baking or aging.
In fact, experiments proved that the result of either proper annealing or simple aging was the same—greatly improved resistance stability. Either approach appeared to relieve internal stress in the coil, and baking was by far the more practical of the two methods.
The 1939 design had a bifilar-wound coil of insulated manganin wire. The two leads were brought through insulators in the bobbin flange, and then the whole bobbin and winding were sealed inside a larger brass outer cylinder. In this way, the effects of humidity were almost totally eliminated and heat transfer from the coil improved.
Very low value resistors are based on bent manganin sheets, and the positioning of the terminals is critical because the terminal resistance is a significant part of the total. Higher value resistances are less sensitive to terminal positioning although all high-precision standard resistances support four-terminal Kelvin measurement.
Robert Brown, applications engineer at IET Labs, commented on his company’s product range. “IET Labs manufactures and calibrates a wide variety of decade standards, standard resistors, capacitors, and inductors. We use numerous 8.5-digit Fluke 8508A Reference Multimeters during calibration of standard and decade resistors.”
The specification of the company’s SR-102/103/104 Transportable Resistance Standards (previously manufactured by esi) confirms the benefits of aging as described by Thomas. For the first two years after purchase, stability is within ±1.0 ppm/year and after two years ±0.5 ppm/year. In addition, the temperature coefficient of resistance is <0.1 ppm/°C at 23°C. These resistors are hermetically sealed within a substantial oil bath with an integral temperature sensor. A chart of temperature-dependent deviation is included to allow resistance value correction depending on the actual oil bath temperature.
As an example of the factors that influence a precision measurement, consider measuring the SR-104, a 10-kW standard resistor, with Fluke’s 8508A on the 20-kW range. With the normal test current of 100 µA and operating within ±1°C of the temperature at which the meter was calibrated, Fluke lists the 365-day absolute uncertainty at 95% confidence level as ±(7.5 ppm of reading + 0.25 ppm of range).
The reading will be very close to 10,000 W, so 7.5 ppm of reading = 75 mW: 0.25 ppm of range adds 5 mW for a total uncertainty of ±80 mW. Requiring a 99% confidence level increases the uncertainty to ±(9.5 + 0.3) ppm or a measurement uncertainty of ±101 mW. Operating the meter with a 10-µA test current to reduce the power dissipated in the resistor being measured further increases the uncertainty percentages.
Several relative as well as absolute uncertainties are listed in the 8508A datasheet. The 24-hour relative uncertainty values are the smallest. But to use relative uncertainty numbers, you need to have calibrated the meter within the specified time period, and you need to know the absolute uncertainties of the calibration standards.
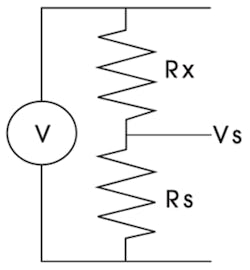
Although multimeters have Ohms ranges and measurement accuracy is good as described, there are other options for measurement of resistance. IET’s Brown explained, “One technique that is used during calibration of resistance, especially for megohm values and higher, is a voltage transfer method. This yields improved uncertainties compared to a direct measurement of resistance because a higher source voltage can be used.
“The output of a very stable voltage source is placed across the known and unknown resistors, which are in series,” he said. “The Fluke 8508A is used to measure the voltage V of the source and the voltage across the standard resistor Vs.” According to Brown, the resistance of the unknown Rx then is given by equation 1, and each individual resistor is measured in a decade box by this method (Figure 2):
where: Rs = standard resistance
Courtesy of IET Labs Because of the large physical size and thermal design of the IET SR-104, the power coefficient of resistance is specified to be <1 ppm/W. This specification helps to determine the maximum test current. In this case, 1 W = 10,000xI2, indicating that a test current as large as 10 mA could be used. A 10-V supply would keep the test current to less than 1 mA, making the effect of the power coefficient negligible.
The 8508A DC voltage uncertainties are much lower than those for direct resistance measurement. Using the 365-day figures and assuming the meter is within ±1°C of its calibration temperature, a 10-V measurement on the 20-V range with 95% confidence has an absolute uncertainty of ±(3.0 ppm of reading + 0.2 ppm of range) or ±34 µV.
The 8508A also supports direct ratio measurements by measuring sources or loads attached to the separate front-panel and rear-panel sets of inputs. When the same range is used for both sets of inputs, the specification sheet’s 20-minute transfer uncertainty figures apply.
For the normal 100-µA test current on the 20-kW range and assuming the meter is within ±1°C of its calibration temperature, the uncertainty in the resistance ratio is based on the transfer uncertainty of ±(0.2 ppm of reading + 0.15 ppm of range). If the resistances are nominally equal to 10 kW, the square root of the sum of the squares yields an uncertainty of about ±0.7 ppm for the ratio:
However, if the resistance ratio is much larger, such as 10:1, then the uncertainty grows to about 3 ppm if the same 20-kW range is used for both measurements. Making the 10-kW resistor measurement on that range but measuring the much smaller 1-kW resistance on the 2-kW range requires use of the 365-day absolute uncertainties rather than the transfer uncertainty.
A DC voltage ratio measurement made using the 20-V range requires the relevant transfer uncertainty figures ±(0.12 ppm of reading + 0.1 ppm of range). Referring to Figure 2 with a 10:1 resistance ratio and a 10-V source, the V/Vs ratio uncertainty is about ±0.5 ppm.
Uncertainties add when measurements are multiplied, so from equation 1, the uncertainty in the Rx measurement is ±1.5 ppm taking into account the uncertainties in both the ratio measurement and the standard resistance. As in the case of a resistance ratio being measured using two different ranges, if different voltage ranges are used for a voltage ratio measurement, the absolute uncertainty figures must be used instead of the transfer uncertainty.
Other 8½-digit instruments include Keithley Instruments’ Model 2002 Multimeter and Agilent Technologies’ Model 3458A Multimeter. Both have measurement capabilities similar to those of the Fluke 8508A. Agilent can compute the ratio of a voltage reading to a DC reference, and Keithley can subtract a value to create a relative reading.
Each instrument is optimized toward specific applications. Keithley offers a selection of scanning options while Agilent supports digitizing with up to 100-k readings/s at reduced resolution. The 8508A, 2002, and 3458A provide both front and rear inputs to facilitate easier integration in test systems. And, all three guarantee exceptionally high measurement accuracy.
References
1. “Samuel P. Langley,” High Altitude Observatory, National Center for Atmospheric Research, National Science Foundation, 2005.
2. Langley, S. P. and Abbot, C. G., “Annals of the Astrophysical Observatory of the Smithsonian Institution,” Vol.1, 1900, p. 17.
3. Holt, T., Calibration Techniques for Precision Power Measurement in Semiconductor Process Applications, Bird Technologies Group, White Paper, p. 5.
4. Thomas, J. L., “Precision Resistors and Their Measurement,” National Bureau of Standards Circular 470, October 1948.


