Physical defects like shorts and opens may occur during any step of the fabrication process. Well-known fault models like stuck-at (SA),1 transition (TR),2 N-detect (ND),3 gate-exhaustive (GE),4 and embedded-multi-detect (EMD)5 and layout-aware fault models on interconnect lines have been used in production for many years. However, these fault models are proving to be insufficient for today’s technologies that require very low defect rates.
Earlier published work introduced the cell-aware (CA) methodology6,7 and showed that the classical SA, TR, ND, and GE approaches do not target all real defects within library cells or are too expensive for production tests. The first production test results were presented at the 2011 ITC.8 In this article, we focus on a full application of the CA methodology, which incorporates at-speed CA tests for bridges and opens for a 32-nm technology, and include production test results from 800k tested ICs of a 32-nm AMD Notebook Processor.
CA Library Characterization
The library characterization is performed once per technology node to create the needed CA view for each cell of the standard library.
As illustrated in Figure 1, the flow starts with the layout extraction from a given layout (gds2) of a standard cell. This is followed by analog fault simulation and CA synthesis, which create the CA test view of a cell. This CA view is passed on to the CA automatic test pattern generation (ATPG), which produces the high-quality CA test patterns.
Defect Coverage Graph
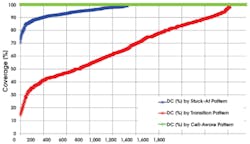
Figure 2 shows the deficiency of the state-of-the-art stuck-at and transition patterns used in the analysis of 1,900 cells from a 32-nm technology. The X-axis represents the library cells numbered from 0 to 1,900. The Y-axis presents three defect coverage rates in percent:
- The blue line is the defect coverage rate for bridges and opens achieved with stuck-at patterns.
- The red line is the defect coverage rate for bridges and opens attained with transition patterns.
- The green line is the defect coverage rate (which is always at 100%) for CA slow-speed and at-speed patterns.
For about 50% of the cells, the defect coverage of stuck-at patterns is less than 100%, and some cells just reach defect coverage of 70%. The situation is troublesome for transition patterns where roughly 10% of the cells reach defect coverage of 100%. In fact, many cells (about 600) have defect coverage of less than 50% while some cells reach just 20%.
Coverage Gain per Cell Type
To analyze the coverage gain per cell type, we performed the CA library characterization. We then performed various fault simulation and ATPG runs with those newly generated CA library views and the selected processor design. We began by fault-simulating the existing stuck-at and transition patterns with the new CA fault simulator to obtain the defect coverage of SA and TR patterns. Next, we generated new CA slow-speed and at-speed test patterns to obtain the defect coverage increase compared to SA and TR patterns.
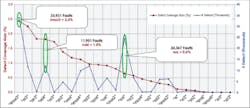
An overview of the defect coverage gain achieved by cell type with the at-speed CA patterns is illustrated in Figure 3. The red line shows the coverage gain, and the blue line presents the number of CA defects related to each cell type. The multiplexer with three data inputs (imux3) achieves the biggest coverage gain (about 2.4%). The nand gate with four inputs (nd4) reaches a coverage gain of 1.8%, and the and-or (aoi) cell attains a coverage gain of 0.6%. On average, a coverage gain of 0.8% is achieved.
CA Detections in imux3 Cells
Deeper investigation into the multiplexer cell (imux3) reveals the potential defects that typically are not detected with the traditional SA and TR tests.
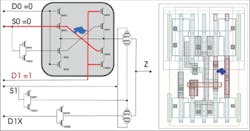
An example of the elusive defects is provided in Figure 4, which shows a bridge between the select input S0 and the data input D1. Normal SA and TR ATPG tools are not forced to assign a value to unselected data inputs, such as to D1, when the D0 currently is selected by S0.
Production Test of a 32-nm Design
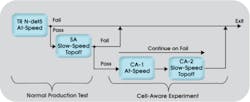
To evaluate the effectiveness of the CA slow-speed and at-speed patterns in relation to the normal production test, we chose a 32-nm notebook processor design. We added the experimental patterns to the test program and changed the test flow to log unique fails of the CA patterns as shown in Figure 5.
The production test consisted of an at-speed TR-N-Detect5 test and a slow-speed SA topoff test. All experimental patterns were in data-collection mode, otherwise known as “continue on fail.” We applied the experimental tests to all die where all four cores passed the existing production test.
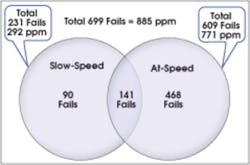
After testing 800,000 ICs, we summarized the fail and ppm reduction results in Figure 6. The data shows that the slow-speed CA patterns found 231 defects that the transition and stuck-at patterns did not detect. The at-speed CA patterns detected 609 defects. These fail counts can be easily transformed into ppm rates; that is, the slow-speed CA patterns reduced the defect rate by 292 ppm and the at-speed CA patterns by 771 ppm.
The Venn diagram also shows the overlap between the two CA tests. In total, the CA tests reduced the ppm rates for this 32-nm design by 885 ppm.
From the 699 parts that failed the CA patterns, 446 were packaged and tested through the production ATE and system-level test flows. All 446 parts passed the final test, which did not contain CA test, but the system-level test (SLT) confirmed that 72% of the parts with unique CA fails had a defective core, and just 28% of the parts did pass the SLT and had to be further analyzed. This means that the package data confirms that CA tests performed at wafer test do detect real defects that otherwise are only detected with SLTs.
Based on the analysis, we can state that the CA method detects various otherwise undetected defects, and as such the overall defect rate can be reduced significantly. For the selected 32-nm process, the defect rate was reduced in total by 885 ppm and improved first-time-right package yield.
Acknowledgements
The authors thank Andreas Glowatz, Andrew Over, Wilfried Redemund, Grady Giles, Juergen Schloeffel, Jeff Rearick, Janusz Rajski, Daniela Toneva, and Anja Fast for their assistance, valuable discussion, implementations, and insight over the course of this project.
References
1. Mei, K.Y., “Bridging and Stuck-At Faults,” IEEE Transactions on Computers, Vol. C-23(7), 1974, pp.720-727.
2. Cox, H. and Rajski, J., “Stuck-Open and Transition Fault Testing in CMOS Complex Gates,” Proceedings of IEEE International Test Conference, 1988, paper 33.3.
3. Pomeranz, I. and Reddy, S.M., “On N-detection Test Sets and Variable N-Detection Test Sets for Transition Faults,” Proc. of VTS 1999, pp. 173-180.
4. Cho, K.Y., Mitra, S., and McCluskey, E.J., “Gate Exhaustive Testing,” Proceedings of IEEE International Test Conference, 2005, paper 31.3.
5. Geuzebroek, J. et al., “Embedded Multi-Detect ATPG and Its Effect on the Detection of Unmodeled Defects,” Proceedings of IEEE International Test Conference, 2007, paper 30.3.
6. Hapke, F. et al., “Defect-Oriented Cell-Aware ATPG and Fault Simulation for Industrial Cell Libraries and Designs,” Proceedings of IEEE International Test Conference, 2009, paper 1.2.
7. Hapke, F. et al., “Defect-Oriented Cell-Internal Testing,” Proceedings of IEEE International Test Conference, 2010, paper 10.1.
8. Hapke, F. et al., “Cell-Aware Analysis for Small-Delay Effects and Production Test Results from Different Fault Models,” Proceedings of IEEE International Test Conference, 2011, paper 9.1.
About the Authors
Friedrich Hapke is director of engineering in Germany’s Mentor Graphics Silicon-Test-Solution Division. He previously held R&D management positions at NXP and Philips Semiconductors. Hapke received a diploma in electrical engineering from the University of Applied Sciences, Hamburg; is the author/co-author of many publications; and holds over 20 patents in the area of design for test. [email protected]
Michael Reese is a senior member of the technical staff at Advanced Micro Devices. He has a B.S. in chemical engineering from the University of Texas and an M.S. in electrical engineering from Walden University. Prior to AMD, Reese held a variety of positions in the areas of silicon design and silicon manufacturing. [email protected]
Jason Rivers is a senior member of technical staff at Advanced Micro Devices. Before joining AMD, Rivers was part of the Advanced Product Research and Development Labs at Motorola. He has a B.S. from the University of California at Davis. [email protected]


