Freedom of choice in the frequency domain

Optimizing the performance of spectrum and signal analyzers involves trade-offs based on each instrument’s strengths and weaknesses. Keysight Technologies’ Sai Yang, product manager microwave and communications division, explained, “Traditional swept-tuned analyzers are widely popular for analyzing signals that are stable in the frequency domain. They are most suited for applications such as power and spectrum analysis, as well as dynamic range, harmonics, and spurious measurements. However, in today’s heterogenic signal environments, traditional swept analysis can fall short where there are pulse and modulated signals, wideband frequency hopping, and short-duration pulses.”
Darren McCarthy, technical marketing manager at Rohde & Schwarz (R&S), elaborated, “The trade-off between a swept-tuned and an FFT-based analyzer can be seen in the speed of performing a spectrum sweep for a given resolution bandwidth (RBW). The advantage of a high-performance signal (spectrum) analyzer, such as the R&S FSW spectrum analyzer with the capabilities of both a … swept-tuned analyzer and FFT-based signal analysis, is the automatic capability to optimize sweep speed for the user based on the selected RBW.
Real-time spectrum analyzers (RTSA) emphasize the speed of FFT calculation so that many thousands of separate FFTs are performed and displayed per second. According to Matt Maxwell, RSA product manager at Tektronix, “Real time means that there is sufficient processing power in the system to see signal events within a spectrum span that other analyzers miss. Only with a real-time display can you see a live RF version of the spectrum … [complete with] interference and other transient signals.”
In addition to conventional benchtop and modular analyzers, several manufacturers provide portable instruments intended for field use. In the past, you had to compromise on performance to get a small, lightweight analyzer. That’s not necessarily the case today with even RTSA capabilities available in some models.
Trade-offs
Large spans
Most modern spectrum analyzers have a hybrid architecture that lies between the traditional swept-tuned model and one that only uses FFT techniques. For very large spans with a wide RBW, a swept-tuned instrument usually is the better choice although noise may be a problem. The displayed average noise level (DANL) of a selected RBW relative to the noise associated with a 1-Hz bandwidth is given by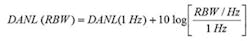
McCarthy gave an example of a 1-GHz to 26-GHz span for which the RBW was reduced from 1 MHz to 1 kHz to improve the noise level by 30 dB. He observed, “Under these conditions, a swept-tuned analyzer … may take several hours to sweep. Under these same conditions, the FSW can cover the band at 8 s/GHz or only 3.5 min (more than 1,000x faster).”
Small RBW speed
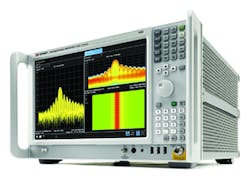
Courtesy of Keysight Technologies
FFT-based analyzers simultaneously capture all activity within a defined band of frequencies—the analyzer’s bandwidth. A few vendors offer systems that can work with high-speed oscilloscopes to achieve multigigahertz bandwidths. However, the largest bandwidths native to a product are 765 MHz for the National Instruments (NI) PXIe-5668R vector signal analyzer (VSA), 510 MHz for Keysight’s N9040B UXA signal analyzer (Figure 1), and 320 MHz for the R&S FSW with the FSW-B320 option. So, to sweep a 10-GHz band to find spurious signals, an FFT-based analyzer would need to make successive captures and stitch them together because each band it captures is only as large as its bandwidth.
Tek’s Maxwell agreed that an FFT-based analyzer has advantages when performing wideband sweeps with a narrow RBW. He said, “There is inherently a higher noise floor associated with capturing signals over a wider bandwidth, but in terms of spectrum analysis, the DANL is not affected because the RBW filtering is applied after the acquisition using DSP.” The wider bandwidth Maxwell mentions is the analyzer’s bandwidth, which is greater than the selected RBW. The required span may or may not be larger than the analyzer’s bandwidth.
An R&S technical note stated that sweep speed is inversely proportional to RBW in an FFT-based instrument but inversely proportional to RBW squared in a swept-tuned analyzer. However, such a clear relationship may not hold for a swept-tuned design that uses FFT-based narrow-RBW filters—a common approach to improving sweep speed.
Portability
Anritsu’s Eric Hakanson, senior product manager handheld instruments, explained that swept-tuned analyzers often use large and power-hungry YIG oscillators. In contrast, FFT-based instruments not only can be much lighter with good battery life, but frequency accuracy and phase noise also may be improved because the LO is fully synthesized.
He commented, “Anritsu handheld analyzers can sweep much faster with FFT. In FFT mode, our [Spectrum Master] MS2720T has a sweep speed that is up to 100 times faster than swept-based analyzers. The trade-off is that users can’t trigger on a sweep. Additionally, sweep time isn’t a simple control as it is with a swept-based analyzer, and there is a slight variation in sweep time when using an FFT-based instrument. The low phase noise allows analyzers using FFT technology to conduct all-important modulation measurements in the field. It also allows us to offer burst detect in the MS2720T. With this capability, the Spectrum Master can capture emitters as narrow as 200 µs to reliably detect ‘bursty’ signals.”
A large number of Keysight FieldFox handheld analyzers are available for spectrum and signal analysis through 26.5 GHz. In addition to spectrum analysis, some models support cable and antenna analysis and also can be used as a vector network analyzer. As a spectrum analyzer, the best DANL is -155 dBm with the preamp on and -139 dBm with it off. SSB phase noise at 10-kHz offset from a 1 GHz carrier is specified as -106 dBc/Hz but typically measures -111 dBc/Hz.
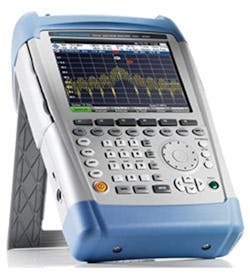
Figure 2. FSH Handheld spectrum analyzer
Courtesy of Rohde & Schwarz
The R&S FSH handheld spectrum analyzer (Figure 2) also has multiple use modes depending on configuration. Frequency range is up to 20 GHz with a 20-MHz demodulation bandwidth for analyzing LTE signals. With the appropriate R&S power sensors, measurements to 67 GHz are supported over the -67 dBm to +45 dBm range. Battery operating time is from 3 to 4.5 hours depending on the model.
As described by Tek’s Maxwell, “The RSA306 is a USB spectrum analyzer that also performs vector signal analysis of signals, including for commercial wireless standards. It also supports real-time spectrum analysis. The VSA capability of the RSA306 can provide a first-level decoding of the signal captured to verify its nature as well as to measure basic signal parameters like error vector magnitude (EVM) of a digitally modulated signal.”
Courtesy of Tektronix
The RSA306 does not include a display but instead uses your PC’s screen along with Tek’s SignalVu-PC software, which performs real-time processing of the DPX spectrum (Figure 3). The frequency range is from 9 kHz to 6.2 GHz. With SignalVu-PC, the RSA306 handles 27 types of modulation, Bluetooth analysis, and AM/FM/PM audio measurement including SINAD and THD.
Signal Hound also has a range of USB spectrum analyzers, the latest being the 6-GHz model BB60C. Company CEO Bruce Devine said that upgraded software will provide “… constellation diagrams, EVM measurements, symbol tables, a gray code handler, I/Q inversion, and bit/symbol pattern recognition for formats of O-QPSK , QPSK, BPSK, 8PSK, π/4DQPSK, DQPSK, and QAM16. At the same time, the BB60C will become compatible with the Signal Hound TG-series tracking generators.”
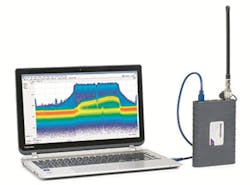
Courtesy of Signal Hound
The separately introduced Spike software upgrade integrates all of the company’s SA-series analyzers and TG-series tracking generators under the same GUI platform as the BB60C. In addition, Spike (Figure 4) supports real-time gapless acquisition for spans ≤250 kHz. According to Devine, “… that means every RF event will be captured when using spans that are ≤250 kHz. In addition, the SA-series graphics now include color persistence and a 2-D waterfall display … [and] the tracking generators also now can save 1,000-point data files that are then loaded in the path loss table for normalizing precision measurements using RF cables and/or antennas.”
Further capabilities
Keysight’s N9040B UXA signal analyzer combines swept-tuned and FFT-based analysis and provides -142 dBc/Hz phase noise at 100-kHz offset from a 1-GHz carrier as well as a spurious-free dynamic range of >78 dB. According to Yang, “The UXA’s spectrum analysis mode can reach a displayed average noise level (DANL) of -166 dBm (1-Hz RBW, preamp on) to help find the smallest spurs and maximize the measurement speed. Furthermore, the standard noise floor extension feature in the UXA can further improve the DANL performance to -171 dBm (1 Hz).”
The UXA also supports the N9068C phase noise measurement application and a separate RTSA upgrade option. In both cases, the user gains benefits equivalent to those of a standalone unit without having to buy another instrument. In a further example of how the UXA can be applied, Yang explained, “…the Keysight 89600 VSA software that supports more than 75 signal standards and modulation types can be embedded into the UXA to provide a comprehensive set of tools for signal demodulation and vector signal analysis.”
PXI
Keysight’s recently introduced M9290A and M9391A are signal analyzers in the PXIe modular format. The M9290A features low cost with both FFT and swept modes to 26.5 GHz. The 9391A offers phase-coherent support for up to 8×8 MIMO, beamforming, and carrier aggregation.
Also in the PXIe form factor, NI’s PXIe-5668R VSA has the bandwidth needed to perform EVM and spectrum mask tests on IEEE 802.11ac signals. As described by Brian Avenell, chief RF hardware engineer at the company, “The PXIe-5668R supports an instantaneous bandwidth of 320 MHz or 765 MHz, depending on frequency range. The capability to measure extremely wide bandwidths in a single acquisition is useful for applications ranging from wireless communications test to radar pulse measurements. Before extremely wide bandwidth analyzers, these measurements were performed by doing multiple acquisitions with a narrower bandwidth or clever signal-processing techniques like Rader’s Algorithm for pulse measurements. Thus, there was a trade-off between measurement accuracy and measurement time.”
He explained, “When you are measuring wideband signals with metrics such as EVM, ideally, the instantaneous bandwidth of the RF signal analyzer should be greater than the bandwidth of the signal. For example, wireless technologies such as the IEEE 802.11ac standard require an instantaneous bandwidth of 160 MHz to perform an EVM measurement. In addition, the spectrum mask requirements for a 160 MHz 802.11ac signal include limits that are ±240 MHz from the center frequency for a total of 480 MHz of bandwidth.”
Avenell continued, “Radar pulse measurements, such as pulse rise time, require a VSA to capture both the main lobe and several side lobes. A general rule for measuring the pulse rise time of X nanoseconds is that the instrument’s instantaneous bandwidth must be 3/X. For example, to measure pulse rise times as low as 5 ns, the required instrument instantaneous bandwidth would be 3/(5 ns) or 600 MHz.”
Analysis and generation
Both the PXIe-5668R VSA and the PXIe-5646 vector signal transceiver are what NI calls software-designed instruments. With this approach, you have the ability to tackle a wide range of analysis problems by altering aspects of the firmware. As Avenell concluded, “The software … features several starting points for your application including application IP, reference designs, examples, and LabVIEW sample projects. These open software starting points include default LabVIEW FPGA personalities and prebuilt FPGA bit files to help you get started quickly and offer the capability to fully customize them.”
Replicating real signals for test purposes is a unique test application for Anritsu’s MS2830A and MS269xA spectrum/signal analyzers. Patrick Weisgarber, business development manager at the company, stated, “… [The] Capture & Playback feature leverages the unique architecture of the MS2830A and MS269xA, which offers integrated vector signal analysis and generation in a single instrument. Capture & Playback enables the user to easily transfer waveform data acquired using the signal analyzer to the integrated signal generator where the signal can be reproduced with the stability and repeatability of a laboratory-grade instrument. After the waveform data has been transferred to the signal generator, the amplitude and frequency can be tuned freely to determine performance margins on the device under test. The integrated signal analyzer and generator share a common time base and can be pattern locked to enable fast and stable measurements on complex, modulated signals.”
Weisgarber described an application of the feature that involved first responders who were unable to use their radios because of interference from a nearby LTE base station. They captured the signal and, by replaying it in the lab, determined that the high-power LTE downlink signal was blocking the P25 signal due to inadequate filtering in the radio’s receiver. The manufacturer implemented a new front-end design, and the end user was able to verify the fix using the MS2830A before deploying the new radios to the field.
Simulation could have been used to solve the problem, but typical simulated signals don’t offer the wide range of conditions and complexity of real-world environments. Field testing inherently is difficult because you have no control of the signal source. You can’t be sure that the worst-case conditions have been encountered even with extensive testing. The Capture & Playback feature solves these problems.
Rigol Technologies and GWInstek provide an optional built-in generator for use as a tracking generator to facilitate measurement of RF cable insertion loss and the frequency response of an antenna, filter, or amplifier. Rigol has upgraded the DSA800 series spectrum analyzer family to 3.2 GHz in the DSA832 and 7.5 GHz in the DSA875.
Jason Chonko, applications engineer at Rigol, commented, “With new designs, the name of the game is flexibility. The new Rigol DSA832 and 875 series of spectrum analyzers are built around a more traditional swept-tuned design coupled with a digital IF and post-processing. This combination gives the analyzers a very low noise floor and the bandwidth selectivity of a traditional instrument while the digital post-processing offers increased flexibility at a low cost. This provides a tool that can address test needs that range from troubleshooting to full production on a single platform.”
Precompliance testing is a major area for both GWInstek and Rigol instruments. Jack Hau, application engineer at GWInstek, emphasized the special -6-dB bandwidth EMC filters provided in the company’s GSP-9300 spectrum analyzer at 200 Hz, 9 kHz, 120 kHz, and 1 MHz. The instrument also supports ASK/FSK demodulation and analysis relevant to many areas such as remote keyless entry, tire pressure monitoring systems, wireless medical telemetry, railway temperature monitoring, and wireless peripherals. The 200-Hz, 9-kHz, and 120-kHz EMC filters are optionally available on Rigol DSA800 series instruments.
And, as described by Anritsu’s Hakanson, the company “has developed a mobile interference hunting system. It utilizes the spectrum analysis capabilities of its handheld analyzers, including its Spectrum Master MS2720T spectrum analyzer, along with advanced software featuring patent-pending algorithms, an off-the-shelf magnet-mount omnidirectional antenna, and a Windows-operating tablet/laptop. A built-in mapping feature and compatibility with Google Maps make it simple to locate the interferer.”
Summary
Spectrum/signal analyzers are available in all popular form factors and with a wide range of standard features and options. Speed clearly distinguishes FFT-based instruments from traditional swept-tuned ones when a narrow RBW is being used. Further, swept-tuned analyzers are best suited to signals that are relatively stable in the frequency domain. Digital modulation requires the wide-band acquisition that distinguishes FFT-based signal analyzers, and a hopping signal may only be captured correctly by an instrument with RTSA capabilities.
About the Author
Comment About the Article
To join the conversation, and become an exclusive member of Electronic Design, create an account today!

Leaders relevant to this article: