Although there are plainly exceptions, the results of this year’s annual EE-Evaluation Engineering salary survey seem to reflect, for the most part, the dour observation on the job outlook from the Bureau of Labor Statistics, which predicts “slow growth or decline in most manufacturing sectors in which electrical and electronics engineers are employed.”1 Comfortingly, at least, the BLS does not expect any significant change in total employment levels through 2024.
If that sounds like a prequel to fairly sober salary numbers, you are correct. As one anonymous respondent noted, “Despite the apparent demand for engineers, it’s still a ‘purple squirrel’ scenario—no one is good enough to be hired, while existing staff wear six hats each.”
“Everything is being outsourced to save money, not to build a better product; good paying jobs are not there anymore, and they are laying people off to get cheaper ones,” observed another.
Yet another elaborated, “There was huge downsizing, outsourcing, and offshoring for many functions at my employer in the past year,” with the related costs seemingly exceeding the savings. “As a result, engineers are spending more time doing things like submitting support tickets for clogged toilets instead of working on the best designs in the world. Along with sizable layoffs in engineering staff, particularly support functions, some great design engineers and other engineers also left the company voluntarily, primarily because of job-security concerns.”
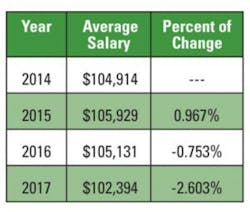
Unfortunately, numbers talk too, and the loudest may be those reflecting average salaries described in Table 1. Those average salaries actually have fallen from $105,929 in 2015 to $105,131 in 2016 and a new reported low this year of $102,394, the latter number representing a decrease of 2.6% from the prior year. However, before you run for the exit doors, recognize that there are many contributions to an aggregation. Other data in the survey, while still troubling, is less grim.
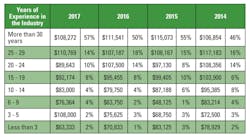
For one thing, experience still counts. Table 2 documents the fact that for those with 25 to 29 years of experience (14% of all respondents), average salaries stood at $110,769. A much larger cohort, representing 57% of respondents, were those with 30 or more years of experience. Their average salaries were slightly lower: $108,272. The rest of the data tracks a relatively bumpy curve. For those having 20 to 24 years in the field earnings averaged $89,643, those with 15 to 19 years of experience actually earning slightly more—$92,174—and those with 10 to 14 years earning $83,000. Continuing that trend, those with six to nine years of experience averaged $76,364 in earnings, and those with less than three years of experience earned just $63,333. The outlier, representing just 2% of all respondents, were those with three to five years, where the reported average salary was $108,000.
Where are you?
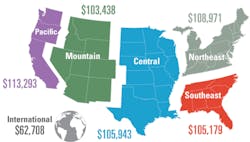
Like the real estate folks say, it’s all about location. In salary matters, where you sit can sometimes tell a lot about what you are going to receive for compensation. However, survey data in Figure 1 shows consistency across most of the United States, with average compensation ranging from a low of $103,438 in the Mountain states and $105,179 in the Southeast up to $105,943 in the Central region and $108,971 in the Northeast. The only real outlier was $113,293—the heftier average compensation in the Pacific Region. International respondents also came in at an extreme—averaging $62,708 in yearly compensation.
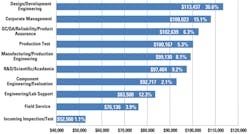
Not surprisingly, the exact nature of what you do on the job is a very big deal. Figure 2 illustrates a wide range of diversity in terms of those functions and relative levels of compensation. On the low end of the scale, incoming inspection professionals earned an average of $52,500, which ramped up to $76,136 for those in field service functions. On the other end of the scale, where job titles also may have reflected higher levels of seniority, the list was topped by those in corporate management roles, earning an average of $108,023 and by design/development engineering pros who earned $113,437. That spread, which has those at the bottom earning less than half of what those at the top take in, illustrates the complexity of the field and the many paths of both entry and advancement.
Credentials count—usually
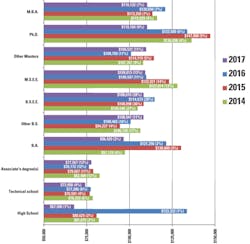
Similarly, while education—both in type and quantity—matters when it comes to compensation, the relationship is complex and changes over time. For instance, Figure 3 reveals the fact that the relatively small set of professionals with no formal education beyond high school had compensation ranges from a low of $67,500 this year—not far below the “lows” for those with technical school training or an associate’s degree. By contrast, however, last year that same category logged a high of $133,333, which exceeded the highs for any other category except those holding doctoral degrees.
However, in the main, as might be expected, those with standard engineering credentials, either a BSEE or MSEE, maintained strong numbers across the 2014 to 2017 period. For BSEEs the numbers ranged from an average compensation $104,546 in 2014 to a high last year of $114,573, before dropping back to $108,070 this year. MSEEs evidenced a steady trend in average earnings, but downward, cresting at $127,814 in 2014 and reaching a low of $109,013 this year. Other categories of educational achievement showed similar variations.
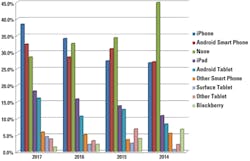
While not directly related to compensation, the survey also has made a point of looking at one of the main indicators of changes within the profession: mobile and device use. Here, in Figure 4, respondents painted a clear picture: those not using mobile technology in their work are in a minority. The reported rate dropped from about 45% of respondents in 2014 to well below 30% this year—a steep decline.
And, Apple’s iPhone has been the most consistent winner, growing its share of users from just over 25% of respondents to nearly 40% over the same period. Android-based smart phones and tablets as well as iPads also grew in use, though not by as much. Blackberry use, on the other hand, continued to decline. And, the survey recorded a scattering of “other” device types in use as well.
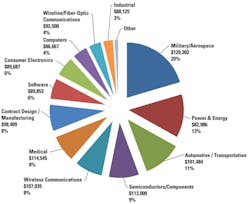
What field or industry you work within is one of the biggest determinants of what you will get paid, as illustrated in Figure 5. Military and aerospace, with an average compensation of $120,302—also representing the largest cohort of respondents, at better than 20%—was the clear winner. Medical ranked second at $114,545, followed by the semiconductors/components area at $113,000, wireless communication at 107,935, and automotive/transportation at $101,484. The low end of the scale was within the power and energy sector, where average earnings were $82,986, and computers, which logged earnings of just $86,667.
Some of these figures differed sharply from the previous year. For instance, power and energy recorded an average earning of $107,037 last year. The reduced average this year may reflect retirement of senior people or some other significant movement in the field.
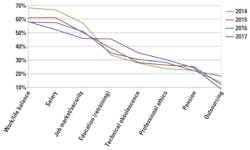
The strands of color across Figure 6 illustrate both the relative ranking of career issues within a given year—the slope merely showing the difference between neighboring data points—and the relative changes in those concerns from year to year. Thus, we can see that work-life balance and salary have both dropped considerably in importance since 2014 while concerns about education and retraining have risen by a substantial margin. Commented one respondent, “Maintain your education so that you can always advance in your career field. Also, having a solid pension and IRA account helps support your retirement.”
Most other concerns, including job market/security, technical obsolescence, professional ethics, pension, and outsourcing have changed slightly over time but within a narrower band. One respondent who works for an aerospace company identified a trend in personal management—an effort to emulate Google or Facebook, which succeeds mostly in alienating the staff. Equal pay for equal work also is a concern. “As the only woman in my position at this company, I am heavily depended upon to know everyone’s job and remember details for everyone yet am paid less than a man with less experience,” wrote one respondent.
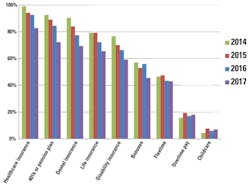
But all is not well when it comes to benefits actually provided by employers. Figure 7 shows that across a wide range of familiar areas, employers have been cutting back, leading to continual declines in benefit availability across five of the nine areas tracked. The provision of healthcare insurance, 401k or pension plan, dental plan, life insurance, and disability insurance all decreased from year to year since 2014. One respondent noted that his company eliminated both its pension plan and vacation plan.
The availability of bonuses and flextime also decreased over the period, though not with the same year-to-year consistency. A rarity among benefits, both overtime pay and childcare grew slightly in availability over the period, though again, not with consistency from year to year.
Summary
Overall, the EE-Evaluation Engineering salary survey paints a fairly sober picture regarding compensation, working conditions, and general career outlook. Again, though, bear in mind that the results reflect factors such as well-compensated senior-level people are starting to retire and may not fully capture the opportunities represented in the market. For instance, one respondent noted, “Qualified, experienced personnel are increasingly more difficult to find in specialty engineering disciplines. Added another, “Finding qualified, experienced embedded systems engineers is hard!”
Still another noted, I am “less than five years to retirement and so are a large number of my peers; we currently do not have any folks being trained to back fill us.” And what training there is may be inadequate. “Training is obsolete before you finish,” reported one employee.
And, as noted, there has been an increase in the availability of overtime pay—often a precursor to hiring. So, clearly there are opportunities. But finding them and securing fair compensation seems to be the inevitable challenge.
Reference
About the Author

