Quick Methods for Reliable Component Testing
When checking and verifying capacitors, inductors, diodes, bipolar transistors, and cables, the gamut of test methods can range from those used to confirm a defective component to identifying the value of one that is unmarked. The general idea behind this testing is to apply a stimulus to the component using a waveform generator and measure the response using an oscilloscope. Specialized component testers would be the optimum course of action, but sometimes such testers may not be readily available.
That’s when you need a quick way to test components with the more commonly available scope and a stand-alone waveform generator. Another option would be a one-box solution for component testing, such as the Agilent Technologies InfiniiVision X-Series Oscilloscope with a built-in waveform generator.
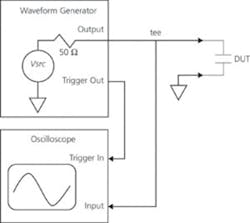
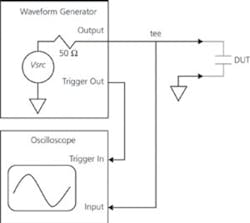
Figure 1. Test Configuration
Figure 1 illustrates the measurement configuration. The waveform generator is connected to the oscilloscope input with a tee off to the component, also referred to as the DUT. For testing surface-mount components, the Agilent Technologies 11060A Surface-Mount Device Probe or equivalent is recommended. The waveform generator voltage (Vsrc) is applied to the DUT through the generator’s 50-? source resistance.
The voltage across the DUT is measured by the oscilloscope input channel. The oscilloscope is triggered from the waveform generator. In the case of Agilent’s X-Series Oscilloscope, this trigger connection is built in, eliminating the need for an additional cable connection and trigger configuration steps. You select the built-in waveform generator as the trigger source.
Capacitor and Inductor Testing
For testing capacitors and inductors, a 10-Hz, 100-mVpk-pk square wave is used as the stimulus. By using such a low voltage, in-circuit testing of the DUT is possible without biasing semiconductor devices which may be connected to the DUT. Also, this low voltage minimizes reverse leakage current on polarized capacitors, which may degrade measurement accuracy.
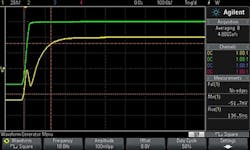
Figure 2. Capacitor and Inductor Measurement
Green = without a DUT connected; Yellow = with a 1-nF capacitor as the DUT
The green trace in Figure 2 shows the oscilloscope measurement with no DUT connected. Averaging is used to reduce noise, which improves accuracy. The automatic min voltage, rise-time, and fall-time (10% to 90%) measurements are turned on, and the trigger-point location is set to the left side.
Capacitor Testing
When the DUT is a capacitor, the circuit configuration is a classic R-C network, with R being the 50-? source impedance of the function generator. The input impedance of the oscilloscope is 1 M?, much greater than the waveform generator’s 50-? source impedance and, for that reason, can be ignored. The DUT’s capacitance value (Cdut) can be calculated from the rise time (10% to 90%) measurement using the equation

For the most accurate measurement, the capacitance of the test system (Ctest) should be measured and accounted for. The recommended method to determine Ctest is to measure a known-good 1-nF capacitor and subtract 1 nF from the measured value to get Ctest.
The yellow trace in Figure 2 shows such a measurement for a 1-nF capacitor. From the rise-time measurement, the calculated capacitance value is 1.24 nF, so Ctest is about 0.24 nF.
Care must be taken in adjusting the oscilloscope’s time-base setting to display the complete transition but not so slow that there is insufficient resolution to measure the transition accurately. A good rule of thumb is to set the time/div between half and twice the measured rise time or fall time. For example, if the measured rise time is 175 ns, then the setting should be either 100 ns/div or 200 ns/div.
Once Ctest is known, then capacitor values larger than 1 nF can be tested. The largest capacitor value that can be tested is limited to 100 µF by the waveform generator frequency. Larger values can be tested by decreasing the waveform generator frequency.
The spike at the beginning of the edge transition occurred during the time required for the stimulus edge to travel through the test system cable to the DUT and return back. This spike is the primary reason that capacitor values less than 1 nF cannot be tested accurately. It can be reduced by using a short connection of less than 6 inches to the DUT, which would enable testing of capacitor values as low as 250 pF.
Inductor Testing
When the DUT is an inductor, an R-L network is formed. In this case, the fall time is measured. In addition, Vmin determines the inductor’s DC resistance (DCR). This DCR is added to the waveform generator’s 50-? output resistance to determine the total R value. The equation relating inductance to fall time is derived as
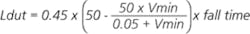
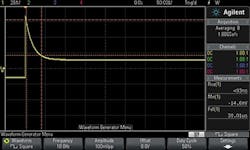
Figure 3. 1,200-µH Inductor Test Measurement
The rise time of the waveform generator limits the minimum inductance value that can be tested to 10 µH. The upper limit depends on the inductor’s DCR. If the DCR is too high, the oscilloscope will not measure the fall time automatically. In this case, the fall time could be measured manually if necessary.
Figure 3 shows the measurement for a 1,200-µH inductor. There is a visible DC voltage drop due to the inductor’s DCR. The calculated inductance measurement (Ldut) is about 1,208 µH.
A defective inductor or capacitor will measure the wrong value or likely appear as an open or short. An open DUT will look like the green tract in Figure 2 whereas a shorted DUT will look like a horizontal trace.
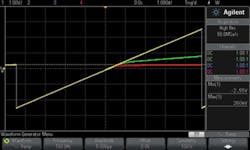
Figure 4. Diode and Transistor Measurement
Yellow = without a DUT connected; Green = with a small signal silicon diode as the DUT; Red = with a power Schottky diode as the DUT
Diode and Bipolar Transistor Testing
For testing diodes, the waveform generator is configured to a ±2.5-V ramp signal at 100 Hz. This is a low-frequency test, so the high-resolution mode is used to reduce noise. Also, the automatic max and min voltage measurements are turned on, and the trigger point is set to the middle. The yellow trace in Figure 4 shows the oscilloscope configuration and measurement with no DUT connected.
This test method differs from what a traditional curve tracer does. A curve tracer plots a DUT’s current vs. voltage. In this test method, the oscilloscope’s horizontal axis represents the waveform generator voltage and the vertical axis the voltage across the DUT. Unlike a curve tracer, the amplitude of the waveform generator is not high enough to test reverse breakdown voltages.
This test method can apply a fair amount of current to the DUT. For example, if there is a 0.7-V drop across a diode, then that leaves a maximum of 1.8 V across the waveform generator’s 50-? output resistance. This means there can be a maximum current of 36 mA flowing through the diode. If the component being tested cannot tolerate this current level, then the amplitude of the waveform generator should be reduced.
Diode Testing
The green trace in Figure 4 shows measurements for a small signal silicon diode, and the red trace represents a power Schottky diode. The small signal silicon turns on at about 400 mV, as expected, and has a noticeable positive slope due to its relatively high ON resistance. Contrast this to the power Schottky diode, which turns on at a voltage of 260 mV, which is predicted with this type of diode.
A defective diode will likely appear as an open or short. An open diode will look like the unconnected DUT shown in Figure 4; a shorted diode will look like a horizontal trace.
LEDs also can be tested using this method. The waveform generator offset can be increased to supply more voltage to the LED if needed.
Bipolar Transistor Testing
Bipolar transistors can be tested with the same method used to test diodes. First, confirm both the emitter-base and collector-base junctions behave like a diode, and then verify that the collector-emitter is not shorted; that is, it should behave like an open circuit.
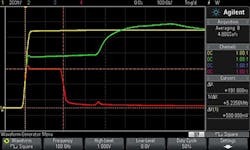
Figure 5. Cable Test Measurement
Yellow = without a DUT connected; Green = with twisted wire as the DUT; Red = with shorted RG-58 as the DUT
Cable Testing
For testing cables, the waveform generator is configured to output a 100-Hz, 0-V to 1-V square wave as shown in the yellow trace in Figure 5. Averaging is used to reduce noise, and the trigger position is set to the left side. Cursors are used for manual measurement of waveform parameters. This test method is essentially a low-speed time-domain reflectometer (TDR).
The green trace in Figure 5 shows the measurement for an unknown length of twisted line wire. The impedance of the twisted wire, Zcbl, can be calculated using the equation
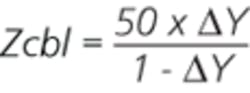
where: ?Y = the voltage at the first step measured manually using the oscilloscope’s cursors
In this case, ?Y is 660 mV, and Zcbl is calculated to be about 97 ?, a typical value for twisted wire. The far end of the twisted wire is an open circuit indicated where the voltage level suddenly increases.
The red trace in Figure 5 is a measurement of an unknown length of RG-58 cable. From the ?Y measurement, the impedance can be calculated to be 51 ?. This is the expected value for RG-58. However, the measurement also indicates the cable is shorted down the line where the voltage returns to zero. If the propagation delay of the cable is known, then the distance to the short can be calculated using

The propagation delay for RG-58 is 1.54 ns/foot. ?X is measured manually with the cursors to be 191 ns. Accordingly, the distance to the short is calculated to be 62 feet.
Conclusion
The general idea behind testing components is to apply a stimulus using a waveform generator and measure the response using an oscilloscope. These techniques can be implemented using a specialized tester or a scope and a stand-alone waveform generator. Another alternative is the Agilent InfiniiVision X-Series Oscilloscope with a built-in waveform generator and integrated triggering.
About the Author
Dennis Weller is a master engineer for Agilent Technologies. He has 30 years of experience working in oscilloscope R&D, marketing, planning, and management roles. Mr. Weller holds a bachelor’s degree in electronic engineering from California Polytechnic State University and a master’s degree in electrical engineering from the University of California. Agilent Technologies, 5301 Stevens Creek Blvd., Santa Clara, CA 95051, 719-590-3647, e-mail: [email protected]
About the Author
Comment About the Article
To join the conversation, and become an exclusive member of Electronic Design, create an account today!

Leaders relevant to this article: