Web-based workflows boost wind farm yield
In the interest of efficiency, Intelligent Fluid Solutions in England used on-demand design, CFD, and optimization software to create a simplified CAD model of a wind turbine. The firm then used the resulting data to simulate an entire wind farm.
Of course, the simulation of a wind farm is quite complicated. Typically, the large computational costs of solving such complex models constrain these kinds of simulations. But workflows (in this case, several main “building blocks” of the design process) hosted on a high-performance computing cluster at dezineforce.com gave the firm flexible ways to determine, for a specific site, the number and spacing of turbines to produce the best total-power-per-cost ratio, also called the objective value.
The firm modeled only the number and layout of the turbines, although it was possible to add other parameters such as wind speed and angle as well as site-specific geographic details. To set up the problem, engineers used a simple staggered turbine arrangement. They parameterized the layout based on 13 turbines per odd-numbered row (even-numbered rows had 12), spaced uniformly across the site width, and a total of 9 rows, spaced uniformly through the site length.
The total power of any given layout comes from summing the power each turbine generates, calculated from the local velocity conditions at the turbine. The total installation cost includes fixed items such as construction, grid connection, and site preparation, and variable costs, which relate to the number of turbines installed. Combining this data generates the objective value in Watts-per-dollar or Euro (W/€). A full evaluation of all of the wind farm’s options would normally require 117 simulations.
The online CFD tools solved the parametric combinations using a so-called sparse method, which gave results based on only 16 initial simulations and a final total of 22 simulations. The method combines design-of-experiments techniques (DoE) and surrogate modeling (building simplified representations) to identify a subset of layouts for evaluation. Once the software carries out initial simulations, it searches the surrogate surface using optimization algorithms and then updates the model.
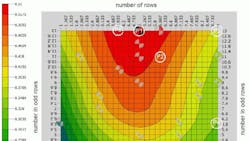
What is called a response surface plotted the objective values. The plot showed that W/€ rises as the number of turbines in the rows shifts up and also as the number of rows nears five. For the parameters considered, 5 rows with 13 turbines in odd-numbered rows, for a total of 63 turbines, gave an objective value of 0.5495 W/€. A design with the same number of turbines but in a different configuration — 6 rows with 11 turbines in the odd rows — predicted a value of approximately 0.504 W/€, significantly less power for the same installation cost due to the aerodynamic interference between turbines.
Although these simulations used just two variables, the method applies equally well to problems with more parameters. For example, it’s possible to predict the expected annual yield of a farm by varying wind speed, direction, and strength.
See:
Intelligent Fluid Solutions,www.intelligentfluidsolutions.co.uk
ieDezine Ltd., www.dezineforce.com
