Design and Simulate an Input Filter for DC-DC Regulators Using LTspice

Switching regulators are widely used because they provide high-efficiency power conversion. However, their switching action also makes them a source of conducted noise. In many systems, especially those that include sensitive analog, RF, or communication circuits, this noise must be controlled before it propagates through the input power bus.
An input filter is often the first line of defense, but it can’t be treated as a simple add-on component. Its resonance, damping, impedance interaction with the converter, and startup behavior can all affect system performance.
This article walks through the practical design of a differential-mode (DM) input filter for a DC-DC converter. It first reviews the basic behavior of an LC filter, including attenuation slope, capacitor equivalent series resistance (ESR), and resonant peaking. It then shows how damping can be added to improve stability, how an undamped filter can create startup overvoltage or output oscillation, and how LTspice can be used to estimate conducted-emissions attenuation and compare single-stage and two-stage filter solutions.
Differential-Mode LC Filter Behavior
An LC filter is a double-pole filter, and its resonant frequency is given by:

Each pole contributes –20 dB/dec of attenuation, for a total of –40 dB/dec. The ESR of the filter capacitor introduces a zero, which contributes +20dB/dec to the slope. The zero frequency is given by:

Figure 1 shows an example of a typical LC filter. L1 and C2 form the filter, C1 is the decoupling capacitor for V1, and Cin represents the input capacitance of the DC-DC converter. A switching DC-DC converter draws a pulsating input current with rich harmonic content due to its switching action.
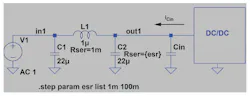
The filter must attenuate this input current across the relevant frequency range so that it doesn’t flow back into the source and pollute the bus voltage that powers other sensitive electronics. As frequency increases, the reactance of C2 decreases while the reactance of L1 increases, causing the current harmonics to be diverted to ground.
It’s desirable for the filter inductor to have neither excessively high inductance nor high direct current resistance (DCR). A large inductance slows the response to load transients. Because the inductor is in series with the input, its DCR should be minimized to reduce voltage drop and power loss. The tradeoff is that, for the same f0, reducing the inductance requires increasing the capacitance. The capacitor ESR also affects the total attenuation at the frequency of interest.
Figure 1 shows an LTspice schematic in which the ESR is stepped between two values, 1 mΩ and 100 mΩ. The value of f0 remains fixed at 33.4 kHz because it’s not determined by capacitor ESR, but the ESR zero, fESR, shifts from 7.23 MHz (1 mΩ) to 72.34 kHz (100 mΩ).
Figure 2 shows the simulation results for this circuit. If the DC-DC converter switches at 1 MHz, the difference in attenuation is 22.7 dB. The ESR zero limits the achievable high-frequency attenuation by reducing the filter slope from –40 dB/dec to –20 dB/dec.
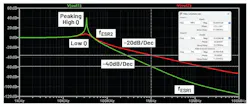
Designers usually prefer components with low DCR and low ESR, and this is generally the right approach. However, because an LC filter is a type of resonant RLC network, very low ESR can produce significant peaking at f0. That means that the output impedance of the input filter reaches a high value, making the design more susceptible to instability.
According to the Middlebrook criterion, the output impedance of the input filter must remain lower than the input impedance of the converter to avoid instability. Therefore, this peak must be damped. This peaking is related to the quality factor, which is given by:

If fESR ≫ f0, the filter will exhibit a high Q and significant peaking, although it will retain the –40 dB/dec slope. If fESR ≫ f0, then Q ≈ 1, which results in a damped response. This can be achieved by adding a series RC branch in parallel with the filter capacitor. For Q ≈ 1, the damping resistor value is:

The damping capacitor is typically chosen to be 3X to 10X the filter capacitor value.
Undamped and Damped LC Filter Design Example
Figure 3 shows the difference between an undamped and a damped filter when the filter capacitor has a low ESR of 1 mΩ. C5 was chosen to be 4.5X the value of C4, and R1 was calculated to be 0.213 Ω, so a 0.2-Ω resistor was used.
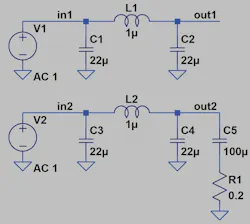
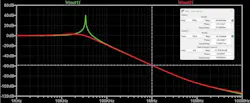
Figure 4 provides the simulation results, demonstrating no peaking and similar attenuation of –58 dB at 1 MHz.
When an undamped filter is connected to the input of a DC-DC converter, two design problems may arise.
1. The IC may fail at startup: At startup, the input voltage can ring to nearly twice VIN. If the design converts 12 V to 5 V and the IC has an absolute maximum input rating of 42 V, this startup overvoltage is unlikely to damage the part. However, in a 28- to 5-V design, the ringing can exceed the absolute maximum input rating, potentially causing IC failure.
2. The output may oscillate: The LC filter has a natural tendency to oscillate at f0, and the pulsating input current can excite this resonance continuously. Figure 5 illustrates the built-in LTspice schematic for the LT8609S. An input filter and additional input capacitors were added to replicate an undamped filter design.
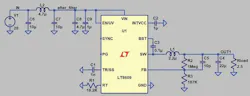
The filter resonance, f0, is determined by L2 and the total capacitance, CT = C7 + C8 + C9, and is calculated as:

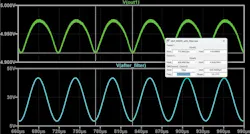
The results are shown in Figure 6, where the output voltage appears to oscillate at the resonant frequency of the filter. Probing the after_filter net reveals the cause: the input voltage is oscillating. In addition, the peak voltage reaches 46.6 V, which exceeds the 42-V absolute maximum input rating of the LT8609.
Design Example in LTspice
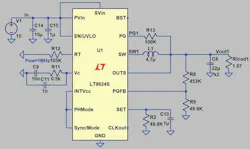
In this example, a radio receiver requires conversion from 15 V to 5 V at 3-A load current. The switching frequency is 1 MHz, and the design must comply with MIL-STD-461G. The LT8624S, a Silent Switcher generation 3 device, was selected for its low noise and low electromagnetic-interference (EMI) performance. Using the datasheet and LTpowerCAD, the component values for this design were calculated (Fig. 7).
MIL-STD-461G provides conducted emissions limits for power leads in CE101 from 30 Hz to 10 kHz and in CE102 from 10 kHz to 10 MHz. The limits are given in dBµV and are intended for use with a line impedance stabilization network (LISN), which is placed between the power source and the equipment under test (EUT).
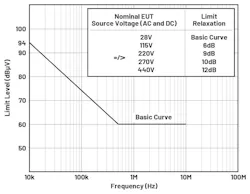
The LISN provides a known impedance, typically about 50 Ω, and converts the conducted current emitted by the EUT into a measurable voltage at its output. An LTspice LISN circuit can be found in the article “How to Get the Best Results Using LTspice for EMC Simulation—Part 1.” Figure 8 shows the CE102 limits graph. For systems below 28 V, the CE102 basic curve gives a flat limit of approximately 60 dBµV above about 1 MHz.
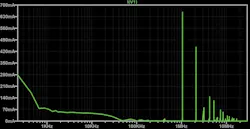
After the simulation is complete, plot the current through V1 by hovering the cursor over the voltage source; the cursor changes to a current probe, after which you can left-click. Once I(V1) is displayed, right-click in the waveform viewer and select View → FFT. A window will open that allows waveform selection for the fast Fourier transform (FFT) display. Select I(V1) and click OK. The FFT of I(V1) is then displayed, with magnitude shown in dB on the left axis.
To convert the magnitude to a linear scale, hover over the left vertical axis until the cursor changes to a ruler, then right-click to open the Left Vertical Axis – Magnitude window. Change the radio button from Decibel to Linear and click OK. The input-current magnitude is then shown on a linear scale. Figure 9 shows that the magnitude of I(V1) is approximately 657 mA.
To convert this current to voltage, use the LISN input impedance of approximately 50 Ω:

To convert 32.85 V to dBµV:

The required filter attenuation is 150 dB – 60 dB = 90 dB. Another way to calculate this is to note that 60 dBµV = 1 mV. This means that:

Dividing the simulated 657 mA by 20 µA gives 32,800, and 20log (32800) = 90.31 dB.
The next step is to determine the filter resonant frequency required to achieve –90-dB attenuation at 1 MHz. The attenuation of an LC filter is given by:


In this process, the inductor is chosen first, and the filter equation is then used to solve for C. An attenuation target of 90 dB is very high for a single LC filter and makes it impractical to choose suitable components while maintaining fast transient response. For example, if a 4.7-µH inductor is selected:

To damp the filter, at least 170 µF × 3 = 510 µF is required, which is excessive. One option is to increase the inductor value and use only a single LC filter. This would reduce the number of components, but at the expense of size, cost, and transient response.
A more practical solution is to use a two-stage LC filter, which forms a fourth-order filter with a slope of –80 dB/dec before reaching fESR. The steeper slope allows f0 to be placed 10X higher in frequency while still meeting the attenuation target. For comparison, with f0 = 56.2 kHz, a 33-µH inductor is selected for the single-stage LC filter, whereas a 1-µH inductor is used for the two-stage LC filter.


Figure 10 shows the two filters, and Figure 11 presents the simulation results. The single-stage filter barely reaches –90 dB and can do so only if the capacitor ESR is 2 mΩ or less, indicating that the ESR zero is already affecting the slope. The 33-µH inductor is too large for fSW = 1 MHz and isn’t well-suited to fast transient response.
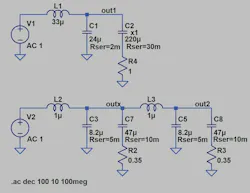
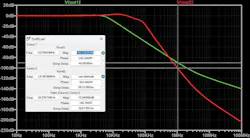
In contrast, the two-stage LC filter provides more than –100 dB of attenuation using smaller-value components. This additional attenuation margin increases confidence that the 90-dB target will still be met even after capacitor derating due to bias voltage and temperature.
Conclusion
This article has shown how an input filter for a switching regulator must be designed as both an EMI filter and a stable power interface to the converter. A simple LC filter can provide strong differential-mode attenuation, but capacitor ESR, resonant peaking, startup behavior, and interaction with the converter input impedance must all be considered to avoid instability or overvoltage stress.
LTspice makes it possible to estimate required attenuation from conducted emissions limits, compare single-stage and two-stage solutions, and verify the benefits of damping before hardware is built. Practical design guidance:
- Start from the emissions target and relevant frequency range.
- Choose the smallest inductance that still provides the required attenuation.
- Use low-DCR components while adding intentional damping when needed.
- Check for resonant peaking and startup overshoot.
- Account for capacitor derating and ESR variation.
- Validate the final design with both frequency- and time-domain simulations before moving to lab measurements with a LISN.
>>Download the PDF of this article
 promo_id_48823543__strixcode__dreamstime
About the Author
Rani Feldman
Field Applications Engineer, Analog Devices Inc.
Rani Feldman joined Analog Devices in 2017 as a senior field applications engineer. Previously, Rani worked for Linear Technology for three years. Rani holds a bachelor’s degree in electronics engineering from Afeka College in Israel and a master’s degree in business and administration from Holon Institute of Technology in Israel.
Related
promo_id_48823543__strixcode__dreamstime

Comment About the Article
To join the conversation, and become an exclusive member of Electronic Design, create an account today!
 Leaders Logo
Leaders relevant to this article: