An Analog Hydraulic Model You Really Need to See
One advantage of writing the editorial column for Electronic Design is that almost everyone reads it. The downside is that the print issue limits the size of the column to just over a few hundred words. It is hard to do justice talking about almost any topic, although it is a great way to get everyone to consider an idea and issue.
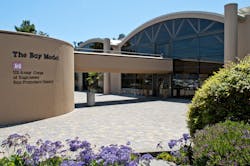
One recent editorial (see “Real Big Simulations” on electronicdesign.com) is about the Bay-Delta Model. The Bay Model visitor’s center (Fig. 1) is located at 2100 Bridgeway in Sausalito, Calif., just across the Golden Gate Bridge. I had a chance to visit the model. As an engineer, I found it a fascinating technological marvel. It was started back in the 1950s and has been retired from active research, but it is open to the public. I had never heard about it and have found that most people do not know that it exists. This includes people in Silicon Valley.

I decided that some of you might like to learn a little more about the Model. Of course, you can check out their site, Wikipedia, and other sites on the Internet, but this is my two cents. I also have a few more photos that hopefully highlight how massive the model is and how much detail there is.
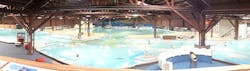
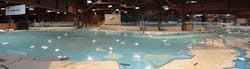
The model was started by the U.S. Army Corps of Engineers in 1957. It is a working hydraulic model of the San Francisco Bay and Sacramento-San Joaquin River Delta System. This includes all the waterways around San Francisco and Silicon Valley. The model covers more than 1.5 acres (Fig. 2). It is contained in a single building. It is the only remaining, large-scale model of this type in the world. There were others, including one for the Chesapeake Bay and one outside for the Mississippi River.
One of the original reasons for building the model was as a response to the Reber Plan. John Reber was an actor, theatrical producer, and schoolteacher who wanted to fill in parts of San Francisco Bay and create a set of channels and dams. It would create freshwater lakes. There would be airports, naval bases, and a canal. The plan was scrapped after the model help highlight the problems associated with the plan.
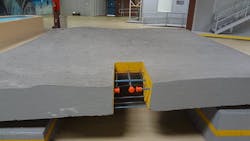
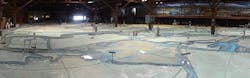
The model is a jigsaw puzzle that is over 320 by 400 feet. It is built from 286 five-ton concrete slabs (Fig. 3). Each slab is supported by adjustable screws on each corner. For the delta portion, flat slabs were formed with the various rivers and sloughs added on top of the slabs. The ocean floor on the other side of the bay bridge was formed with a thin layer of concrete over a sand bed. The model has been modified over time by cutting out or adding concrete as necessary.
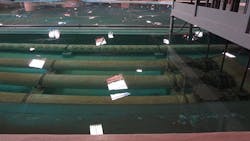
The horizontal scale is 1:1000 while the vertical scale is 1:100. This was to keep the model small enough to be practical while providing sufficient vertical resolution. The designers employed copper strips (Fig. 4) spread throughout to properly simulate the proper hydraulic flow because liquid movement differs as the environment is scaled down.
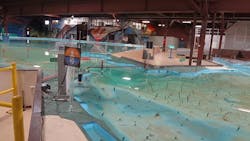
The system runs continuously at a time scale of 1:100. This lets you watch the tides go in and out and what the coverage of various areas is. Many areas are dry when the tide goes out. The bay itself is much shallower than it was originally. One of the main problems was the California gold rush, which used high-power jets to blast dirt and rock into streams to extract gold. Unfortunately the resulting silt ran down into the bay where it collected (see “San Francisco Bay Slowly Recovering from Gold Rush Miners' Devastating Legacy”). The bay is still recovering from this massive erosion and there are areas that are significantly more shallow than they were before this event. Keeping the bay clear for shipping is just one of the challenges for the U.S. Army Corp of Engineers.
There are some local landmarks that have been highlighted like the San Francisco airport in the South Bay (Fig. 5). This is more to provide orientation for visitors rather than adding to the realism of the simulation.
These days, modeling is done using computers. Usually very large supercomputers. That is what high-performance computing (HPC) in the cloud is about. Big data and all that. It is more complex, more accurate, and so on but those few blinking lights (ok, the LEDs tend to flash for disk-drive access and network connectivity) hardly hold a candle to big data from big models.
So what has the model been used for more specifically? As noted, the model was initially used to evaluate hydraulic changes caused by various barrier plans. It has also been used to check water-quality problems associated with circulation patterns and to examine hydraulic changes caused by reclamation of shallow portions of the bay. It was also useful in checking out sediment-disposal procedures for navigation channel dredging.
The delta portion of the model (Fig. 6) was added to address details such as salinity changes associated with the deepening of navigation channels. Salinity is critical in this environment and it changes because of the tides. Fish even move along the boundary where fresh water from rivers and streams meets the salt water from the ocean. This boundary is continually moving.
Salinity changes can occur when there is a failure of levees and flooding of islands in the delta as well. Likewise, water transfer projects such as thermo, municipal, and agricultural discharge projects needed to be evaluated to see what their impact would be before they were done. Of course, problems such as oil-spill cleanup and even forensic challenges like searches for drowning victims and finding evidence in homicide cases could be augmented by using the model. Maybe even more important to many these days is the preservation of water supply during drought.
The Model has been used to reproduce the water levels, water velocities, and salinity gradients in both the horizontal and vertical directions. This includes perturbations within localized areas of the model and essentially the real world. The model does not take into account other forces such as heat or wind induced circulation. Statistical analysis was typically done for multiple runs.
The model has not been static since its inception. Instead, it has been improved over the years as technology has improved. This has reduced the noise factor thereby improving the accuracy of the results.
Because of the high level of Model sensitivity, quality control is an important aspect of its operation. The quality control extends from the preparation for tests, to the conducting of the tests, to the checkout at the conclusion of the tests.
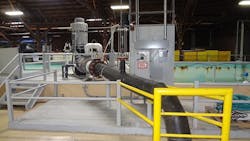
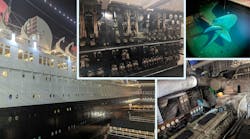
Keeping the model running is not an easy task. There is a lot of heavy-duty hydraulics behind the system (Fig. 7).
There is a lot hidden out in the ocean (Fig. 8) that obviously does not match what is really there, or is it?
The system must be periodically cleaned to reduce algae and salt buildup. There is calibration of instrumentation in addition to exact placement of probes at each station to provide accurate and repeatable results. Even the mixing water-supply tanks must have the correct salinities otherwise tracking of salinity would falter.
These days computers manage the tide generator using monitoring instruments to check the operation of the system. Boundary conditions such as ocean salinity are double checked using both Beckman meter and titration. The conductivity meters are checked for drift using a “bucket” check that has a bucket with a known salinity concentration. The model is actually washed after tests to remove any salt buildup that may have occurred.
If you are in the area you should really see the model in person. It is easy to spend a couple of hours checking it out. Add a comment here if you have seen it and what you think of it.
More Interesting Engineering Articles
About the Author
William Wong Blog
Senior Content Director
Bill's latest articles are listed on this author page, William G. Wong.
The latest blogs have been moved to alt.embedded on Electronic Design.
Bill Wong covers Digital, Embedded, Systems and Software topics at Electronic Design. He writes a number of columns, including Lab Bench and alt.embedded, plus Bill's Workbench hands-on column. Bill is a Georgia Tech alumni with a B.S in Electrical Engineering and a master's degree in computer science for Rutgers, The State University of New Jersey.
He has written a dozen books and was the first Director of PC Labs at PC Magazine. He has worked in the computer and publication industry for almost 40 years and has been with Electronic Design since 2000. He helps run the Mercer Science and Engineering Fair in Mercer County, NJ.
- Check out more articles by Bill Wong on Electronic Design
- Bill Wong on Facebook
- @AltEmbedded on Twitter
Comment About the Article
To join the conversation, and become an exclusive member of Electronic Design, create an account today!

Leaders relevant to this article: