How to Properly Interpret SSD Performance Numbers
With the ongoing increase of storage capacity, the transfer speeds have to increase in a similar manner. SATA solid-state drives (SSDs) deliver an immense improvement over conventional hard-disk drives (HDDs), and the very latest PCI Express SSDs boost this performance even further.
Performance is a key differentiator between SSDs. It seems rather easy to compare two devices with each other as every manufacturer releases datasheets with indications of megabytes per second (MB/s) and input/output operations per second (IOPS), but this is far from reality. Datasheets more often than not provide an insight into fresh-out-of-the-box performance numbers, but it’s important to be able to weed through the forest of unrealistic performance figures and interpret them for what they really are.
The sequential read and write performance is stated in MB/s. Sequential operations access locations on the storage device in a contiguous manner and are generally associated with large data-transfer sizes (e.g., 128 kB or more). On the other hand, random operations access locations on the storage device in a non-contiguous manner and are generally associated with small data-transfer sizes (e.g. 4 kB). The performance of random read and write operations is stated in IOPS. Datasheets of the latest solid-state drives will easily claim 3000 MB/s for sequential write performance and 200,000 IOPS and more for random write performance.
How Immense is the Difference Between Best- and Worst-Case Performance?
One would expect that these values can be achieved continuously. To verify our own flash-memory controllers and compare them with our competitors, we rigorously test them in our lab. Our standard test comprises of a CrystalDiskMark performance test to test the initial so-called “fresh-out-of-the-box” performance. This is followed by a 72-hour continuous random write workload generated by IOmeter. After this, a CrystalDiskMark performance test is done again to evaluate the “steady-state” performance—the worst-case performance.
It might not be very surprising that there’s indeed a difference between best- and worst-case performance, yet the magnitude of difference between the two is massive. Even more surprising is the extremely short time it takes the performance in the IOmeter test to deteriorate.
After testing dozens of solid-state drives. we can conclude that the vast majority is barely able to maintain its advertised performance for 100 seconds –i.e., one and a half minutes. Performance dropped significantly in all tests.
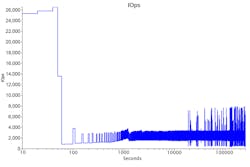
Figure 1 shows an exemplary progression of IOPS over test time from one of our tests. The first thing to note is that the drive was advertised with “up to 84k IOPS” and the first measurements show close to 26k IOPS for roughly 50 seconds. After that period of time, the performance plummets down to barely over 1k. After 15 minutes of test-time, the performance starts oscillating around a value of 1.8k IOPS for the next 71 hours.
1. The continuous random write workload on the drive and the corresponding performance in IOPS shows an exemplary progression of IOPS over test time.
What’s Causing Such Severe Performance Drops?
There are various reasons for the performance of solid-state drives to drop. The flash-memory controller continuously executes tasks in the background: garbage collection, wear-leveling, dynamic data refresh, calculation of RAID data, and calibration. During short read and write accesses, the controller is able to hide this from the user. Because most benchmarks usually run for only a few seconds, they don’t capture the performance degradation over time.
After we saw how the performance decreases quite quickly in the previous test, we will now examine how the performance varies over the lifetime of an SSD. To measure this, we sequentially write data to the SSD until it’s full, and then read back all of the data while measuring the time it takes for each task. This is done repeatedly until the end of life of the drive.
How Does Flash Technology Influence the Speed of the Drive?
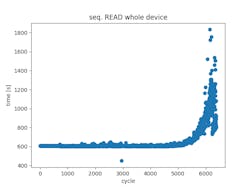
First of all, Figure 2 shows that the tested drive had a lifetime of 6,000 cycles. This is among the best results of the drives using the current generation of 3D triple-level-cell (TLC) flashes, as most of them live for about 3,000 cycles. More than one-fifth of our tested drives failed before even reaching 2,000 cycles. The time has passed when flash memory technology was new and the initial single-level-cell (SLC) technology offered 100,000 cycles of lifetime.
2. Read time of the whole device increased toward the end of life. As the time increased by a factor of three, the speed decreased to 33% of the initial speed, respectively, as the tested drive had a lifetime of 6,000 cycles.
With the introduction of TLC flash and a higher amount of errors in the flash memory, new error-correction methods were needed. These use a technique called soft-decoding to cope with high amount of errors that are usually found toward the end of life. Soft-decoding reads data from the flash memory multiple times, which significantly increases the time needed to read data and therefore minimizes performance, as can be seen in Figure 2.
Yet, higher bit errors aren’t only seen toward the end of life with the TLC and quad-level-cell (QLC) flash technology. They’re much more sensitive to cross-temperature effects. This describes a situation where data was written to the memory at one temperature and read out at another. Even in a normal laptop, temperature can easily vary from room-temperature (25°C) when starting it to 50 or 60°C after a few hours of use. Applications like navigation systems in cars encounter far higher temperature differences. With TLC and QLC flash technology, it’s much more likely to encounter a high amount of bit errors from the memory requiring soft-decoding, thus reducing performance.
Apart from the higher bit error rates, TLC and QLC flash technologies have another disadvantage: the flash memory itself is slower due to increased read and programming times. To conceal this from the user, most drives use part of the memory in SLC mode, which stores fewer bits but operates much quicker. This SLC cache is usually a few percent of the drive’s capacity. It can be responsible for the drop-in performance that was explained earlier: once the cache is full, the write speed decreases.
What Impact Does Temperature Have on Performance?
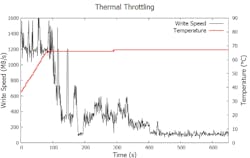
In addition to that, performance depends heavily on the temperature—ambient temperature as well as internal temperature of the drive. Figure 3 shows a PCI Express (PCIe) SSD in a continuous sequential write test done at room temperature of approximately 25°C. The drive is able to transmit more than 1.2 GB/s for about 95 seconds, after which the die inside the package has heated up considerably. To protect itself from overheating, a mechanism called thermal throttling is executed. The drive limits its performance to minimize the power consumption and thus reduce the heat building up inside.
3. This PCIe SSD continuous sequential write test was done at room temperature of about 25°C. The drive can transmit more than 1.2 GB/s for about 95 seconds, after which the die inside the package has heated itself up considerably.
Datasheets will highlight an absolute peak performance that can only be reached under perfect conditions and only for a brief amount of time. High temperature, which can also be caused only by the drive being active, cross-temperature effects, the type of memory, the capacity of a fast cache, and the stage of the drive’s life, are factors that significantly influence the performance. As a result, consider that the numbers in the datasheets only reflect one single aspect of this whole topic when comparing SSDs.
Sandro-Diego Wölfle is Product Manager at Hyperstone.
About the Author
Sandro-Diego Wölfle
Product Manager
Sandro-Diego Wölfle is responsible for product life-cycle management, i.e. the activities from product proposal, development, launch, and mass production until the end of life. Having worked as senior hardware design engineer before, he has a deep understanding of Hyperstone´s technology. He holds a Master in Electronics and Information Technology from the Karlsruhe Institute of Technology, Germany and a Master in Business and Leadership from the Zeppelin University, Friedrichshafen, Germany.


