This article is part of TechXchange: Trace Debugging Techniques
Download this article as a PDF
A debugger can help track down problems in an application. Setting a breakpoint and stepping through code can help developers understand how an application is really working and see where problems may occur. The problem with this approach is many applications are time sensitive and stopping them in the middle of an operation can be catastrophic. For example, hitting a breakpoint in the middle of a motor control application can do bad things to a high-speed, spinning rotor that is no longer being controlled in real time. Likewise, tracking hundreds of threads running in a GPU can be equally challenging.
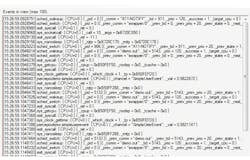
Trace tools complement conventional debuggers, but they are often overlooked by developers. These tools are typically part of a development suite but take a different approach to debugging, as trace facilities capture large amounts of information that can sometimes be analyzed in near-real time or during post-analysis. Of course, raw trace data tends to be overwhelming in size with thousands or millions of entries with lots of details (Fig. 1).
For example, Green Hills Software’s SuperTrace Probe can capture up to 4 Gbytes of trace data at core clock rates up to 1.2 GHz and trace port speeds over 300 MHz. Instrumented software is another way to capture trace information. Hardware has the advantage of low or no overhead, whereas instrumentation incurs some overhead. Lauterbach’s Trace32 family of hardware platforms even support hypervisor awareness.
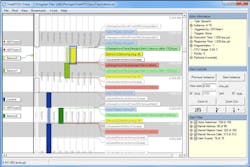
The trick to utilizing all this trace information is to have good presentation and analysis tools. Percepio’s TraceAnalyzer (Fig. 2), can take advantage of the LTTng Project’s Linux Trace Tool (LTT) output and present it in a variety of graphical formats, both to highlight workflow and timing considerations and to identify errors. Percepio has more than two dozen ways to graphically view trace details, making it easier to identify different types of problems.
Software trace instrumentation can be added to applications and some operatinSg systems have it built in. This allows tracking operating system events like thread context switches, service API calls, and system interrupts. Express Logic’s own TraceX works with its ThreadX RTOS, which is also part of the Renesas Synergy solution that delivers both microcontroller hardware and matching software (including ThreadX).
The granularity of trace information can affect how the information is analyzed and utilized. For example, the Green Hills Software TimeMachine debugging suite, part of the MULTI IDE, captures the instruction counter so it is possible to step forward and backward through code that was executed. The interface is similar to what a developer has with a debugger, but a conventional debugger can only move forward through program execution. Of course, TimeMachine is limited to following threads that have already finished executing, but that is what a developer will want to examine.
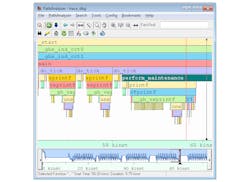
The Green Hills PathAnalyzer (Fig. 3) provides a more compact view of an application’s call stack over time. It allows developers to determine where a program may divert from the expected path. It can also highlight how interrupts or random bugs affect the desired application operation. A complementary tool called EventAnalyzer uses the trace information to track down problems like deadlock.
Using trace tools in a multicore or asymmetric processor environment can be challenging but very useful, since communication and synchronization issues tend to be difficult to debug using conventional means. Synchronizing the trace information is the more challenging aspect but hardware-based solutions tend to do this easily. Software-only solutions are more problematic and dependent upon the hardware, which may or may not make this possible.
Trace tools can be useful in analyzing issues such as latency and deadlines that are difficult to examine using other means. They can also be handy for examining processor utilization and finding memory leaks.
Read more articles in TechXchange: Trace Debugging Techniques
About the Author
William G. Wong
Senior Content Director - Electronic Design and Microwaves & RF
I am Editor of Electronic Design focusing on embedded, software, and systems. As Senior Content Director, I also manage Microwaves & RF and I work with a great team of editors to provide engineers, programmers, developers and technical managers with interesting and useful articles and videos on a regular basis. Check out our free newsletters to see the latest content.
You can send press releases for new products for possible coverage on the website. I am also interested in receiving contributed articles for publishing on our website. Use our template and send to me along with a signed release form.
Check out my blog, AltEmbedded on Electronic Design, as well as his latest articles on this site that are listed below.
You can visit my social media via these links:
- AltEmbedded on Electronic Design
- Bill Wong on Facebook
- @AltEmbedded on Twitter
- Bill Wong on LinkedIn
I earned a Bachelor of Electrical Engineering at the Georgia Institute of Technology and a Masters in Computer Science from Rutgers University. I still do a bit of programming using everything from C and C++ to Rust and Ada/SPARK. I do a bit of PHP programming for Drupal websites. I have posted a few Drupal modules.
I still get a hand on software and electronic hardware. Some of this can be found on our Kit Close-Up video series. You can also see me on many of our TechXchange Talk videos. I am interested in a range of projects from robotics to artificial intelligence.


