In spite of being always on, wired, enabled, and empowered, millions of workers still travel to their places of work each day. Coincident with the rollout of communications services to support employees telecommuting from home, high-tech trains are carrying more of those who can’t.
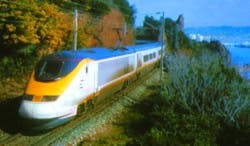
The Acela trains Amtrak is introducing to improve service to the Northeast were highlighted in a recent Business Week article.1 A far cry from the lonely whistle blowin’ “Blues in the Night” train, these are 150-mph, 12,500-hp, streamlined vehicles designed to compete with air shuttles in the congested Boston-New York-Washington, D.C. corridor.2
Amtrak hopes that fast trips, outlets for laptops, and generally updated amenities will tempt business travelers away from the airlines, but these are only the visible attractions. Beneath the shiny silver and blue livery is the latest AC traction technology based on Alstom’s European Train á Grand Vitesse (TGV) experience.
Increased complexity and performance variations are the result of catering for different standards. For example, in northern France, where curves and grades have been modified and a catenary 25-kV single-phase AC supply is used, the train reaches 186 mph.
On the English side of the channel, between the Chunnel and London, the top speed is limited to 100 mph by tighter curves and a much lower capacity 750-VDC supply distributed via a third rail. Only 4,560 hp is developed primarily because current is limited to about 750 A per each of 12 pickup shoes.
Trilingual power supplies necessitated a departure from the previous synchronous traction drive system used on French TGVs. Instead, the Eurostar is based on an asynchronous drive. Unfortunately, the variable motor drive frequency can interfere with signaling frequencies that share the track currents. To make matters more complicated, different frequencies are used by different countries.
And don’t forget that this train carries passengers under the English Channel, resulting in many safety issues. TGVs are train sets; that is, the cars and power units are permanently attached to each other. Eurostar, however, is coupled in the middle, allowing the train to be split in half. Because there is a power unit at each end, the two shortened trains can travel independently in an emergency.
Also, each power unit may be detached from the remainder of the train if necessary. Any required reconfiguration is accomplished entirely from within the train itself. In addition, individual cars are pressurized, and there are separate fire doors between each. Fire detection and extinguishing capabilities are built into the traction units.
A Big Change From Diesel
Verifying the design of a system as complex as a modern high-speed train is a major engineering and planning project. Derek Robinson, an instrumentation engineer at Alstom’s Transport Division in Preston, U.K., discussed some of the more challenging aspects:
“Testing can go on for a whole year. It starts with a period of stability checking to see how the power unit performs under transient conditions. For example, we would interrupt the voltage to simulate the train going over a line gap, and we could see how it recovered from that very short transient. If there is a bit of instability, we can alter the control software parameters to deal with it.
“We look for instabilities in each part of the circuit for six to eight weeks, depending on the complexity of the system. If we have already produced a similar system, the test period may be shortened to three to four weeks. Then we can start looking at thermal measurements. We instrument the power units with thermocouples and check to see if anything is overheating.
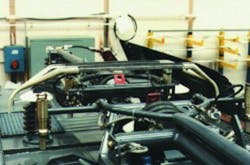
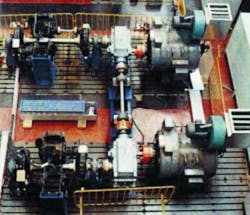
“Power-unit testing is done by using a DC motor/generator as our load machine. By varying the field of that machine, we can oppose or assist the train motor.”
“Power generated by the DC motor/generator may drive another DC motor/generator that, in turn, drives an AC generator synchronized to the AC power grid,” Mr. Robinson said. “In this way, because we regenerate power back into the grid, we only have to make up the losses. There are certain tests where we would use a resistive load, for example in the static testing of an inverter, but it’s not something you would do for a prolonged period of time.”
Having satisfied themselves that the power unit was performing correctly, the engineers undertake further testing using simulated route conditions. The DC motor/generator load machine can be computer-controlled to simulate the mainline East Coast route profile between London and Edinburgh, for instance. Elevation and curve dimensions and the locations of the stations are known in great detail. So, all the accelerations and decelerations that you would have in service are performed.
“We also take into account any signaling compatibility problems that there may be on a particular system,” he continued. “All railway companies seem to have different frequencies for their signaling systems. We have to design the input power filters so that they do not output those frequencies onto the rails.
“Via computer simulations, we can show that the particular frequencies the system uses won’t be reflected back onto the line. Then we have to show that the real equipment works correctly on our test bed and again once it gets onto the actual line.
“We have people who do nothing but work on signaling compatibility. There are a number of Alstom trains running in different parts of the world, taking measurements and sending this information back to Preston for analysis. We must confirm that we do not infringe on local specifications, or if we have infringed, determine why. Of course, if a modification to our system is required, then we will do it.
“On the drive side, we get the AC input, rectify it, feed it into a DC link inductance, and then manufacture a waveform to drive the three-phase induction motors. We also can regenerate back onto the line, for example, during braking. It gets complex when you are regenerating back into the 25-kV line. On the DC systems, it is very simple.
The Measurement System
“Typically, there are about 30 transducers that measure separate currents and voltages. These are all calibrated so we can record and verify what the equipment is doing. The signals feed into a 19² rack that acts as an interface for the transducers: it provides power as well as burden resistors where required. Output voltages are stored on a tape recorder and monitored by a thermal chart recorder.
“Power meters are used to determine power, power factor (PF), and rms volts and amps. The meters have analog outputs, so we can add these signals to the chart record if we want to. Our engineers will make decisions based on the chart traces.
“For 25-kV systems, we’re only talking about a few hundred amps. For this current level, we use a current transformer (CT). We include a Hall effect transducer as well if we want to measure any DC component. When you first close onto the line, you get an inrush into the transformer that’s quite a large DC spike. To measure that, we use the Hall effect transducer.
“For voltage, we usually use the transducer that’s fitted to the train, the one the vehicle’s electronics will use for its calculations. We add another transformer at the output of the transducer for isolation.”
The waveforms shown in Figure 4 (see April 2001 issue of Evaluation Engineering) correspond to repeated motor acceleration and braking. Following the spikes caused by initializing the 1,500-V link voltage, the supply current increases to about 650 A over a 12-s period. The “train” now is moving, and because the inertia has been overcome, the current will decrease although a constant speed is maintained.
In the first of the three test cycles, the “train” coasts for about 5 s before a negative, reversing current is applied. When the negative current returns to zero, the “train” has stopped. The second test cycle eliminates the 5-s delay and moves smoothly from positive to negative current before the final stop. In the third cycle, a very short interruption of drive current precedes braking. The purpose of all three tests is to continue control-system stability.
References
- St. Pierre, N., “Track Star,” Business Week, Dec. 4, 2000, pp. 72-82.
- Arlen, H. and Mercer, J., “Blues in the Night,” 1941.
- Instrument Transformer Basic Technical Information and Application, General Electric, Publication GET-6544, www.geindustrial.com/industrialsystems/
meter/applicat/insttran/index.htm.
Current Transformers
Although they are intended especially for current measurement, current transformers still are transformers: They obey the basic transformer equations that relate primary and secondary voltages and currents by the transformer turns ratio, n = turnssec/turnspriVsec = n × Vpri Isec = Ipri/n Rpri = Rsec/n2
Standard instrument-grade CTs are rated according to the primary current required to produce 5 A in the secondary winding. For example, a 400:5 CT has a turns ratio n = 80 and requires 400 A flowing in its primary to produce a 5-A secondary current.
Accuracy depends on the burden applied as a load to the secondary. The term burden is used to distinguish this impedance from the actual primary side load. Ideally, the burden would be a pure resistance, for example, 0.5 W. It follows that with a 0.5-W burden, a 400:5 CT primary would exhibit a reflected resistance of 78 µW plus the effect of wiring from the CT to the burden resistor.
Of course, a burden can be more complicated than a simple resistance. It may include the input impedance of an ammeter, a watthour meter, and the cabling used to connect them to the CT. In general, the burden is a complex impedance that affects the PF of the secondary circuit.
Accuracy typically is specified by the CT manufacturer at a secondary PF of 1.0 and 5.0-A current. For other PFs and lower currents, your measurements must be compensated by applying correction factors. The overall transformer correction factor (TCF) is equal to the manufacturer’s ratio correction factor (RCF) minus the appropriate phase angle (PA) correction corresponding to the PF. Practical examples are given in Reference 3.
Return to EE Home Page
Published by EE-Evaluation Engineering
All contents © 2001 Nelson Publishing Inc.
No reprint, distribution, or reuse in any medium is permitted
without the express written consent of the publisher.
April 2001
