New Tool for Defining Vehicle Noise
It is a common driving experience. The stoplight changes to green, and as you slam your foot to the floor, you experience the audible and tactile sensation of your engine accelerating you forward until sensibility and the speed limit bring you back to reality. Few people realize just how carefully engineered an event this really is.
Automakers live and die by the subjective impression their vehicle makes on their customer, and drilling down to expose the mechanical relationships that govern the driving experience is the great challenge of automotive engineering. For a noise and vibration engineer, this process usually manifests itself as a search for the optimal interaction between forces and structural dynamics as it relates to driver impression.
Not surprisingly, a major source of noise and vibration in a vehicle can be attributed to the various rotating and reciprocating elements. When you refer to order domain analysis, the implication is that periodic loading exists that excites the structure at a frequency in direct proportion to the speed of a rotating or reciprocating element.
The resulting response also is periodic and manifests itself as a discrete frequency and related harmonics at some multiple (order) of the fundamental process. The principal value of this data is found as the orders move through a range of frequencies revealing amplitude and phase variations that can be attributed to specific path dynamics and source characteristics.
Gabor order tracking (GOT) is a newly developed technique for performing a highly selective extraction of order-related energy from a time-domain signal.1 However, to appreciate the fundamental impact of this technology, you first must be introduced to the Gabor methods of time/frequency analysis. While competing order-extraction methods are classified as either frequency-domain or time-domain based, GOT is native to the time/frequency domain and is something else altogether. Specifically, the method really is a new type of general-purpose time/frequency filter, and order tracking is just one of many possible applications.
The Discrete Gabor Expansion
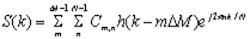
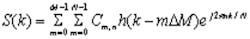
In 1946, Dennis Gabor, a Hungarian-born electrical engineer and winner of the 1971 Nobel Prize for contributions to the principles underlying the science of holography, published his now-famous paper “Theory of Communication.”2 In his paper, Gabor proposed that any signal could be expressed as a weighted summation of time-shifted and frequency-modulated (shifted in the frequency domain) Gaussian functions. The discrete Gabor expansion is defined by Equation 1:
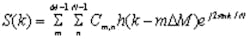
where: M = the number of time sampling steps
N = the number of frequency sampling steps (spectral lines)
The product MN is equal to the total number of Gabor coefficients Cm,n and the ratio MN/B is called the oversampling rate where B is the overall length of the data sample.
Provided there is a means to calculate Cm,n and that the function h(k – mDM) is known and has desirable properties, a plot of Cm,n will show a representation of the time/frequency distribution of energy in S(k). Gabor’s work originally considers h(k) to be the Gaussian function.
For that reason, the idea of the Gabor expansion is to express a signal S(k) as a weighted summation of elementary functions formed from Gaussian weighted complex exponentials that exhibit a corresponding Gaussian-shaped spectrum. The effect is to divide the time/frequency domain into a regularly spaced grid known as a Gabor lattice.
As illustrated in Figure 1 (see below), the discretization represented by the lattice can be thought of as a collection of overlapping oval-shaped regions whose proportions are governed by the variance of the Gaussian and with sampling density governed by the length of the window L and the amount of overlap DM. The Gabor coefficients Cm,n represent the relative information content of the signal captured by the corresponding elementary function at each coordinate on the lattice.
Figure 1. Discretization of the Time/Frequency Domain by Translated and Modulated Gaussians Based on a Gabor Lattice
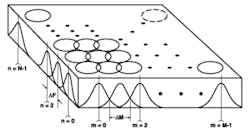
In the same way that the Fourier transform represents a signal as a weighted summation of complex exponentials, the Gabor expansion represents a signal as a weighted summation of windowed complex exponentials. The difference is that no information regarding the time evolution of a signal is provided with the Fourier transform.
The Gabor Transform
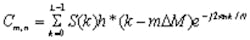
Gabor’s proposed expansion was brought into the mainstream of time/frequency analysis when, in 1980, Bastiaans discovered that the Cm,n in Equation 1 are, in fact, precisely the Fourier coefficients produced by the short time Fourier transform (STFT).3 In other words, the Gabor transform states that
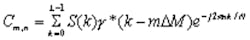
which is exactly the STFT, or equivalently, the inverse Gabor expansion (* indicates vector transpose).
The properties of the function g (k) desirable in the Gabor transform are the same as those desirable of h(k) in the Gabor expansion. However, the relationship that links the two of them is not particularly intuitive.
In a typical scenario, the analysis function g (k) is used to calculate the Gabor transform (STFT) with time/frequency resolution suitable to distinguish important details. For reconstruction, the synthesis function h(k) is calculated and then used in the discrete Gabor expansion to recover the signal.
Once this inverse relationship is established, then it becomes possible to consider masking strategies that will alter the Gabor coefficients in the time/frequency domain and permit the reconstruction of only the desired portions of the original signal in the time domain.
The Dual-Function Relationship
Mathematically, g (k) and h(k) are designed to share what is known as a dual-function relationship. While the details of this relationship are mathematically complex, the basic outcome is quite simple.4,5
The amount of time/frequency oversampling is known as the Gabor sample rate and is just the ratio of Gabor coefficients in the time/frequency domain to samples in the time domain. It turns out that as the time/frequency redundancy increases the analysis window g (k) and the synthesis window h(k) can be made to converge until they become effectively identical, producing what has become known as the orthogonal-like Gabor transform.6
Given sufficient oversampling in the time/frequency domain, the orthogonal-like Gabor transform pair can be stated as:
Time/Frequency Masking
The notion of reconstructing a signal from a subset of the Gabor coefficients is the foundation of many of the most powerful applications of time/frequency analysis. In GOT, the idea is to retain only the order-related energy from the time/frequency diagram for use in the reconstruction. In this way, an amplitude- and a frequency-modulated order is extracted with exceptionally narrow bandwidth and presented at the sampling resolution of the original signal.
Since the reconstruction is a weighted summation of Gaussian functions and not an adaptive filtering operation, it is free of typical filtering artifacts such as phase shift, overshoot, and passband ripple. In fact, results will show that GOT permits an incredibly discriminative extraction of order-related energy even in cases of exceptionally high slew rate.
Consider the very practical example of a full-throttle run-up of a vehicle on the road including shifts. Order analysis of a signal of this type will defy all traditional methods, which are ill-equipped to handle the rapid transient that occurs during the shift.
In Figure 3, the 4th order component extracted from the sweep by GOT is shown in comparison to the same component extracted with a Vold-Kalman tracking filter.7,8 Figure 3 also superimposes the envelope of both of these signal components, which is augmented by two insets to reveal details.
The close comparison of the two methods is obvious. In fact, GOT duplicates each detail that is present in the Vold-Kalman extractions. However, GOT produces a smoother result.
Effective Filter Shapes
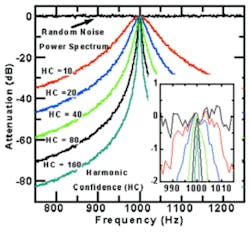
A detailed inspection shows that the Gabor extractions reproduce the spectrum of the original signal exactly inside the mask, while the Vold-Kalman filters closely approximate it but do not reproduce it exactly. The deep flanks and absolutely flat passband response indicated by the Gabor effective filter shape have been informally referred to as a signal scalpel.
In fact, it is possible to create arbitrarily shaped masks to extract virtually any signal detail. The only limitation is that the desired feature can be made to be distinct and separate from undesired ones in the time/frequency domain.
Summary
GOT is just one of many applications for the Gabor methods of time/frequency analysis. Noise reduction, data compression, complex time-varying filtering, and other novel masking strategies are possible.
Perhaps, one of the most intriguing attributes is the idea of high-performance order tracking without a tachometer signal. In effect, you could draw the mask by hand as long as the order is visible and sufficiently resolved.
One critical issue for future development is how to handle the special case of very close orders and crossing orders. While the newest generation of the Vold-Kalman filter has evolved to handle this issue, future work on GOT is needed to solve this problem as well. Although it is acknowledged that much remains to be done before GOT can claim to be proven on practical problems, it is our belief that the striking simplicity of its implementation and the elegance of the underlying mathematics are likely to promote a rapid deployment of this technology.
Acknowledgment
To see a commercial implementation of GOT, download the free demonstration of GABRIEL at www.roushind.com > Test & Measurement products> GABRIEL.
References
- Wei, J., Hui, S., and Qian, S., “Discrete Gabor Expansion for Order Tracking,” submitted to IEEE Transactions of Instrumentation and Measurements for publication.
- Gabor, D., “Theory of Communication,” J. IEE (London), Vol. 93, No. III, pp. 429-457, November 1946.
- Bastiaans, B., “Gabor’s Expansion of a Signal Into Gaussian Elementary Signals,” Proceedings of IEEE, Vol. 68, pp. 538-539, April 1980.
- Wexler, J. and Raz, S., “Discrete Gabor Expansions,” Signal Processing, Vol. 21, No. 3, pp. 207-221, November 1990.
- Albright, M. and Qian, S., “A Comparison of the Newly Proposed Gabor Order Tracking Technique in Comparison to Established Methods,” SAE Paper No. 2001-01-1471, SAE Noise and Vibration Conference, May 2001.
- Qian, S. and Chen, D., Joint Time-Frequency Analysis, Prentice Hall, 1996.
- Gade, S., Herlufsen, H., Konstantin-Hansen, H., and Vold, H., “Characteristics of the Vold-Kalman Order Tracking Filter,” Bruel & Kjaer Technical Review, No. 1, 1999.
- Vold, H. and Leuridan, J., “High-Resolution Order Tracking and Extreme Slew Rates, Using Kalman Tracking Filters,” SAE Paper 931288, May 1993.
About the Author
Michael Albright is manager of advanced projects at the Roush Anatrol Division of Roush Industries. With expertise predominantly in the automotive industry, he has addressed a diverse range of noise and vibration control issues. Mr. Albright received a B.S.M.E. from the University of Cincinnati in 1985 and an M.S.M.E. from Purdue University in 1989. Roush Anatrol Division, Roush Industries, 11953 Market St., Livonia, MI 48150, 734-779-7400, e-mail: [email protected]
Return to EE Home Page
Published by EE-Evaluation Engineering
All contents © 2002 Nelson Publishing Inc.
No reprint, distribution, or reuse in any medium is permitted
without the express written consent of the publisher.
February 2002
About the Author
Comment About the Article
To join the conversation, and become an exclusive member of Electronic Design, create an account today!

Leaders relevant to this article: