Power Meter Displays Eliminate Guesswork

For measurements in TDMA systems, such as GSM, the power sensor/meter combination must follow the fast rising and falling edges of a burst transmission. Gating and triggering allow you to specify the desired time slot(s) where the average or peak power is to be measured. Video bandwidth is the measure of the envelope speed that the sensor and meter can track.
CDMA signal excursions can be very short and may correspond to a large peak-to-average ratio. To capture all the level changes in the combined signal from many simultaneous transmissions, high video bandwidth sensors and fast sampling meters must be used. Typical sampling rates are 1 MS/s or faster, and a 5-MHz video band- width is not unusual.
Seeing the Power
User involvement in the measurement process begins with the selection of the signal to be measured. Before digital modulation, this was accomplished by con- necting the power meter to the cable carrying the desired signal. If the application involved pulsed power, the user would calculate the average power by multiplying the meter’s reading by the pulse duty cycle. If it was on for half of the time, its average power was half of the meter reading. Otherwise, you simply read the average power directly from the meter’s dial.
That level of operational simplicity isn’t possible today. For example, to measure the average power of a TDMA/GSM signal, you must determine the average power inside a burst. As an example of the facilities manufacturers are providing, in Giga-tronics power meters, there are two methods of obtaining this information.
“The BAP mode is a proprietary feature that automatically synchronizes the meter to the bursted signal,” said Steve Reyes, marketing manager at Giga-tronics. “The meter then samples and averages the modulated signal inside the burst between the 50% points. This method automatically configures the measurement process.
“If the measurement must be made between points other than the 50% points,” he continued, “such as the 5% to 95% pulse-width requirement for GSM, then the time-gate mode may be used. When setting a time gate at a specific location, the Model 8650A Power Meter provides the capability to set the gate using the numerical display when the exact time frame is known or using a graphic display of the burst and gate location when visual feedback is desired.”
A 240 × 120-dot resolution LCD is used in the 8650A. Because the display area is not predefined as in an n-row character LCD, a large number of formats are readily accommodated. The variety of text messages ranges from four lines of large characters reading CW power for two channels, their ratio, and peak power on one channel to help screens with eight or more rows of text. Graphics include both power vs. time and statistical plots. The completely general nature of the matrix display means that more functions can be added as required.
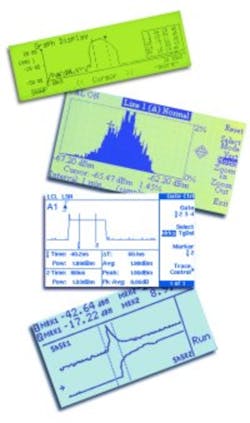
Agilent Technologies also uses an LCD in the EPM Series Power Meters, but these panels have a 320- × 240-pixel resolution—so-called one-quarter VGA. Like Giga-tronics, Agilent presents a wide range of formats, including a single-line numeric display specifically intended for easy viewing at a distance. The EPM display is segmented with soft-key labels occupying the right-hand 20% to 25% of the screen and measurement results and graphics in the remainder, as shown in Figure 1.
As part of the general trend from text-only displays to graphics, Agilent introduced the analysis screen and a zooming screen capability for the EPM Series in a mid-2001 firmware enhancement. Giga-tronics added the 8650A with graphics capability between 1998 and 1999. The previous Model 8540C could make many complex measurements, but the display was limited to two lines of alphanumerics.
Although the Agilent EPM Meters can make up to four separate measurements on a single burst, an auxiliary PC software program is provided to determine detailed statistical, power, frequency, and time measurements for CDMA and TDMA signals. Screen size, instrument operational complexity, and cost are factors behind this decision. Ian Messer, Agilent’s product manager for power meters and sensors, provided a good discussion of the trade-offs:
“Because the EPM-P Series Power Meters were designed for wireless communications R&D and manufacturing, predefined, single-button instrument configurations were provided for common TDMA and CDMA formats. The dilemma is what information to show on the meter display vs. that of an external PC or laptop.
“Having the trace, sometimes referred to as the pulse profile, available on the meter display is very important, especially as a confidence check that the signal is being seen correctly by the sensor/meter combination and that the triggering is OK. The debate usually focuses on the comparatively small display size of the meter and the usability of a PC, keyboard, and mouse and the engineer’s familiarity and preference.”
Anritsu also uses a graphics LCD in the ML2430A Series Power Meters. The custom panel’s resolution is 64 × 256 pixels. Two distinct ranges of meters and sensors compose the series. The ML2437A (single-channel)/ML2438A (dual-channel) meters have a 100-kHz channel bandwidth and handle standards such as GSM, PHS, PCS-1900, DECT, and IS-136 TDMA. The meters sample at 35 kHz and primarily are intended to measure average power, including average power within a burst.
The ML2407/08A Meters provide 1.4-MHz bandwidth and measure IS-95 N-CDMA signals when used with the MA2460A/B Series Fast Diode Sensors. The top sampling rate for these meters is 100 kHz.
N-CDMA measurements include average power, peak power, and crest factor.
The meter’s display accommodates a variety of text formats as well as power waveform profiles and the accompanying measurement data. However, like Agilent, Anritsu has provided PC software that displays signal characteristics in much greater detail than possible on the meter’s small LCD panel. The PowerSuite program also adds statistical power analysis and automated amplifier compression analysis to the pulse and GSM time-slot measurements available on the meters.
In contrast to the other meters that emphasize compactness and portability, the Boonton 4500A Peak Power Meter is very clearly a benchtop instrument. This is the only power meter that has an integral 7² color VGA display and a built-in 1.44-MB floppy disk drive. As many as 14 automatic measurements can be updated 20 times per second. Flexible markers, pretrigger capability, delay by time and events, front-panel setup storage, and a persistence mode round out the feature set (Figure 2).
According to Rick Theiss, a Boonton application engineer, “When measuring a GSM EDGE signal, you need a real-time interactive display of the signal to ensure that the power meter is not false triggering and that you are synchronized to the data you are trying to measure. The complex 8PSK modulation used by EDGE yields a somewhat noise-like wider power envelope compared with the fairly flat envelope of GSM’s GMSK modulation.”
Whereas the 4500A is targeted at the design engineer, Boonton’s 4530 Series is intended for production test. It shares many of the 4500A’s capabilities and manages to simultaneously display the positions of two markers and six automatic measurement results on its 80- × 160-pixel LCD panel. As in the 4500A, an IEEE 488 interface is standard. Boonton now is part of NoiseCom, officially the Wireless Telegraph Group.
Ergonomic Considerations
With the exception of the Boonton Model 4500A, portable power meters use LCD panels of no more than one-quarter VGA resolution (240 × 340 pixels). When you consider that there typically are several words and values on the screen in addition to a statistical plot or power waveform, it’s obvious that the graphics quality will suffer. Nevertheless, even using less than one-third of the total LCD area for a power waveform display as Agilent does still gives visual feedback that the measurement has been set up correctly.
It is important, however, that you have the option to view the captured data in more detail via one of the available software packages. In some cases, additional functionality has been provided beyond that in the meter. In most cases though, you are able to view the effect of more samples in greater detail, in color, using familiar Windows controls.
Although a small display may be adequate for benchtop measurements, it’s lightweight and low power requirements make it ideal for field work. Both Agilent and Anritsu offer battery operation for on-site power measurement. If you intend to use your power meter for this purpose, make sure the display contrast holds up in bright sunlight. What appears to be a good display in a laboratory setting may not be at all suitable in field-service applications. Similarly, if you need to operate the meter in dimly lit areas such as wiring cabinets, check the brightness of the panel backlight.
Also, consider the speed of the display. A fast update rate isn’t too important in the statistical analysis of pseudorandom noise-like signals such as CDMA, WCDMA, and HDTV, where peak power is monitored over a long time. But, in real-time applications, such as the interactive tuning of an amplifier or filter, the update rate of the meter’s analog-like peaking display determines how readily the adjustment can be made.
Boonton’s Mr. Theiss summarized the use of the display in today’s power meters. “The most basic need of our customers is to quickly and easily view measurements. The most important or primary measurements are displayed in a larger font. Our customers also need to analyze power signals in the time and statistical domains,” he continued, “and they may need to view multiple channels. Color helps to distinguish overlapping traces from each other and correlate graphical channel data with its measurement.”
When choosing a power meter, comprehensive graphics display capabilities should be high on the list of required features. But, take time to consider the role of the complete meter/sensor system in your application to make sure you know what performance you can expect. You may find, for example, that several types of sensors are necessary if you plan to measure a number of different format signals with wide dynamic ranges. No matter how good the display is, it’s only one part of the measurement solution.
Measurement Requirements vs. Sensor Technology
Average power always is correctly measured by thermocouple, thermistor, or diode sensors, within their respective dynamic range limitations, regardless of signal modulation. However, the dynamic range of a thermocouple sensor is from about -30 dBm to +20 dBm, and that of a thermistor is even less. Diode sensors directly measure the rms value of input signals from -70 dBm to -20 dBm.
In contrast to thermocouple sensors that simply burn out if overloaded, diode sensors exhibit nonlinear behavior above -20 dBm. Sensors that claim to have a 90-dB range use diode technology to handle very small -70-dBm signals but must be corrected for the inherent nonlinearity from -20 dBm to +20 dBm.
For average-reading CW sensors, the linearity correction usually is done after the averaging filter. In contrast to the large peak-to-average values characteristic of two-tone modulation and more complex signals, CW signals encompass phase, frequency, or amplitude-modulated carriers. For that reason, linearity correction after averaging is unambiguous: The amount of power between -20 dBm and +20 dBm that corresponds to a certain diode output voltage always is the same for CW signals.
The requirement for high speed in peak-power measurements limits the choice of sensor technology to diodes. Thermocouples and thermistors are much too slow to respond to a signal-level change measured in microseconds. In this application, the diode output is sampled and stored. Linearity correction is applied to each sample individually before further processing, such as averaging. The average power of CDMA signals can be measured with either a thermal sensor or a corrected peak-reading diode sensor.
Only a fast diode sensor can measure the separate excursions of a CDMA signal. The statistical characteristics of a CDMA signal cannot be determined from an average-reading sensor. For example, the Boonton Model 4500A Peak Power Meter presents peak power, average power, peak-to-average ratio, and graphs of the PDF, CDF, and CCDF.
Recently, multipath sensors have been developed that combine two or three diode/attenuator networks. They are designed so that at least one of the diodes will operate in its true rms region over the entire -70-dBm or -60-dBm to +20-dBm range. These sensors correctly measure the average power of any signal within the dynamic range, without sample linearization.
However, they are not peak-detecting sensors and cannot be used to determine CDMA statistics, for example. Some sensors of this type do have sufficient video bandwidth to be used in TDMA applications. Anritsu terms this a fast CW mode in the MA2480/01 Universal Power Sensors.
It is true that average power can be measured by a peak or modulation sensor/meter combination. Terminology varies among manufacturers, but these fast diode sensors all have reduced dynamic range compared to a CW-only sensor. It’s a matter of greater noise being associated with a wide video bandwidth. You get the best measurement results by using a sensor that’s closely matched to your application.
| Glossary | |
| 8PSK | 8-phase shift keying |
| BAP | burst average power |
| CCDF | complementary CDF |
| CDF | cumulative distribution function |
| CDMA | code division multiple access |
| CW | continuous wave |
| DECT | digital European cordless telecommunications |
| EDGE | enhanced data rate for GSM evolution |
| GMSK | Gaussian minimum shift keying |
| GPRS | general packet radio service |
| GSM | global system for mobile communications |
| HDTV | high-definition TV |
| N-CDMA | narrowband CDMA |
| PCS | personal communications service |
| probability distribution function | |
| PHS | personal handyphone system |
| TDMA | time division multiple access |
| WCDMA | wideband CDMA |
Reference
Lecklider, T., “Power Sensors: The Sharp End of RF Power Measurement,” EE-Evaluation Engineering, February 2001, pp. 26-36.
Return to EE Home Page
Published by EE-Evaluation Engineering
All contents © 2002 Nelson Publishing Inc.
No reprint, distribution, or reuse in any medium is permitted
without the express written consent of the publisher.
May 2002
About the Author
Comment About the Article
To join the conversation, and become an exclusive member of Electronic Design, create an account today!

Leaders relevant to this article: