
Even 1 MB is a short memory if your signal�s too long to fit.
The solutions to real application problems require more than basic oscilloscope functionality. What�s needed is the right combination of signal connectivity, triggering, acquisition speed, memory depth, and display and analysis capabilities. If any one part is missing, you may not be able to address all aspects of the problem, or it could be very awkward to do so.
A wide range of capabilities is provided in a scope to suit the instrument�s general-purpose use. For example, triggering on the absence of a repetitive signal is useful in power brownout/blackout troubleshooting, histograms show the statistical distribution of measured parameters, and integration determines the energy dissipated during semiconductor switching. However, these functions are only part of a complete solution.
Application Examples
Detailed discussion of a few actual examples will demonstrate that a combination of capabilities often is required.
Power Supply Development
DC-DC switch-mode converters are the primary focus for Shea Petricek, a field applications engineer for Intersil in Austin, TX. Because these supplies switch at rates from hundreds of kilohertz to the low megahertz and operation over tens of milliseconds needs to be observed, a long-memory DSO is required. Only a long memory can record the thousands of switching cycles that characterize the supply�s dynamic performance.
The multiphase buck converters Mr. Petricek works on have synchronous rectification and output current of 120 A or more. The absolute value of any voltage is no more than 25 V or 30 V, but he confirmed that the combination of amplitude, bandwidth, and lack of a ground reference can make some measurements challenging.
For example, viewing the gate-to-source voltage of the control field-effect transistor (FET) requires a differential high bandwidth measurement not referenced to ground. Neither node is at ground potential, and both waveforms are fundamentally square waves. The common-mode voltage can be in the range of 20 V. Most high-frequency active FET probes have adequate bandwidth but lack both differential- and common-mode voltage range.
A new design of differential probes intended for power applications addresses these requirements. Some manufacturers� probes are battery-powered with a simple BNC signal connection to the scope. Other manufacturers make power, control, and signal connections to the probe through a proprietary scheme such as LeCroy�s ProBus Interface.
As an example, the LeCroy AP033 Active Differential Probe with �10 attenuation has �4-V differential and �42-V common-mode ranges while providing a 500-MHz bandwidth, 2-M�10 attenuator to give an overall �100 attenuation increases the differential voltage range to �40 V. differential input resistance, and 1.6-pF differential input capacitance. Adding an external
An important but often overlooked differential probe specification is de-rating of the common-mode rejection ratio (CMRR) with frequency. As Figure 1. shows, the CMRR significantly decreases with increasing frequency. In the case of the AP033, guaranteed CMRR in the �1 attenuation setting is specified at three points, two of which are designated by x�s in Figure 1. From the typical performance shown, CMRR with �10 attenuation can be as low as 22 dB.
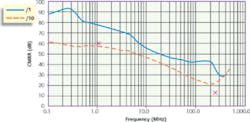
Courtesy of LeCroy
It�s easy to see that measurement accuracy will degrade above 20 MHz or 30 MHz should a large common-mode signal exist as, for example, in a power supply�s floating gate drive circuit. So, although the AP033 does have a 500-MHz bandwidth, its usable frequency range may be much less depending on the application.
However, even data with common-mode interference can be very useful. Many experienced analog engineers have developed a keen ability to extract quantitative answers from data that can only be taken as qualitative.
Figure 2a shows the example gate drive circuit voltages as recorded by Mr. Petricek. In this case, Ch1 displays the ground referenced FET source voltage, and Ch3 is the floating gate to source voltage. The low side of the Ch3 measurement actually is the FET source (Ch1) that swings between ground and 19 VDC with additional high-frequency noise exceeding 35 V peak.
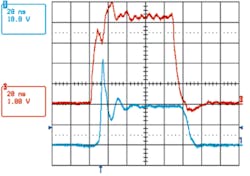
FET Source Voltage CH1 and Floating Gate-to-Source Voltage CH3
Courtesy of Intersil
Measurements were made using a LeCroy LT344L Oscilloscope and an AP033 Differential Probe. Good probe CMRR provides a detailed measurement even though the differential signal is riding on the Ch1 waveform. The repetition rate of these pulses is 800 kHz. Figure 2b shows the same measurement using 20-MHz bandwidth limits on the oscilloscope. Note the loss of detail.
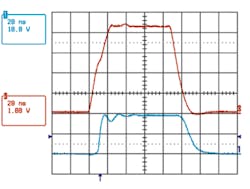
Waveforms With 20-MHz Band Limit
Courtesy of Intersil
Signal Integrity
The change in PC signal routing from parallel to serial buses has allowed higher speed data transmission with fewer errors. However, with the 2-GHz to 3-GHz rates have come new signal-integrity worries. For example, dielectric loss becomes important above 1 GHz, and it adds to the loss caused by skin effect. At these speeds, you even must avoid PCB layouts that route the signal through several vias or add inductance to the return path by changing board layers.
These kinds of factors are a few of the signal-integrity issues with which computer-design engineers become involved, especially when simulating the effects of a new bus technology before it�s implemented in an actual product. It is important that proper test methods as well as PCB layout rules are established early in the adoption phase of new technologies.
When hardware exists, the performance of the serial buses must be characterized. High-speed data waveforms are pattern dependent because pulse distortion is affected by the waveform that preceded a particular pulse. This is the reason that serial buses have adopted communications industry techniques such as using an 8b-10b scheme to equalize the number of transitions within a time period.
A long-memory DSO is used to capture very long serial data streams to develop an eye pattern. This kind of test helps to confirm that the bus is operating within the required tolerances. In addition, long serial streams contain all possible combinations of bit transitions, and data-dependent errors can be found by analyzing acquired records.
Using a DSO to observe the distortion of a very fast edge as it travels down a bus is another good way to characterize bus and termination imperfections. Long memory is not required, but high bandwidth, good triggering, and the capability to probe differential signals are important.
Signal integrity is difficult to quantify with any single instrument or method. For example, electromagnetic-field solving software may be used to model every transmission line in a new product. To account for the effects associated with very complex multilayer structures, time-domain reflectometry (TDR) also is used.
Available software can synthesize a network that corresponds to experimentally derived TDR waveforms. These network descriptions then are used to build a more accurate simulation model. When the simulated performance is adequate and hardware models are built, DSOs help to verify correspondence between expected and actual performance.
Disk-Drive Development
As PCs continue to adopt 64-b microprocessors in place of 32-b devices and application programs grow to tens of megabytes and beyond, ever-greater amounts of cheap disk storage capacity are wanted. Doing his part to satisfy the need, Bart Green, a development engineer at IBM�s Burlington, VT, facility, has been involved in disk-drive read channel development for many years.
He commented that one of the most informative tests uses a long-memory DSO to capture a complete track of information. �We trigger at the beginning of the track and capture the whole track. Then we can go back and look at points in time when the channel detected an error. With all the data from the track, we can try to figure out what analog part of the waveform may have caused the error. It�s almost a forensic process.�
This type of work requires 16-MB or 32-MB memory depth. The actual analog read signal is acquired at an 8-GS/s or 16-GS/s sampling rate after being boosted by the disk drive�s built-in preamp. The differential signal level is about 100 mV at frequencies up to 1 GHz. A DSO with adequate bandwidth and sample rate and a suitable differential probe are needed to capture this signal.
As well as being analyzed for sources of errors, the recorded data also serves as a convenient test pattern to exercise proposed digital detector designs. A small compute farm was set up to run several C algorithms that each emulated a digital detector design. Because the error rates associated with all the algorithms were very low, long, detailed data files were required for testing.
In addition to recovering data previously written to a disk, the read-channel electronics include a write circuit. At very high data density, the exact position of a data pulse is affected by adjacent magnetic patterns written to the disk.
As Mr. Green explained it, �The properties of the magnetic surface change based on what�s already there. For example, if you are writing short, one-length magnets, the starting edge of the next magnet may move in due to self-erasure that will occur from the next magnet. This phenomenon depends on the data before and after the affected edge and the size (length) of the magnet written.�
The effect is to change the timing of the data that is read back from the disk, potentially making correct interpretation very difficult. To overcome this problem, the write circuit precompensates by writing the next magnet a little later, assuming it will move because of the data preceding it.
Because precompensation depends on the composition of bits either side of the bit being written and the data density, it only approximately corrects the magnetic effect. As a result, this is another area where the DSO is used to characterize edge-positioning accuracy.
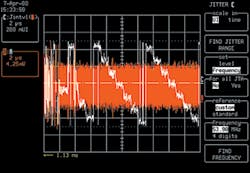
In Figure 3a, data corresponding to several disk sectors has been recorded. Zooming two areas containing identical data disclosed a progressive and unwanted timing shift. The same data was analyzed for the amount of interval-based jitter present, and this is shown in Figure 3b.
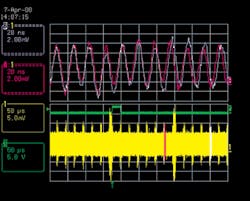
Courtesy of IBM
Courtesy of IBM
Trace C displays jitter as the variation in time between each data edge and an internal DSO reference clock. The periodicity of the jitter and its relation to other disk-drive electronics events pointed to a clock phase-locked loop (PLL) update problem, which Mr. Green then was able to confirm and correct.
Summary
Analog oscilloscopes may be capable of measuring a few signal parameters, but their main function is the display of one or more signals in real time. DSOs display signals too, but because they are acquired in digital form, they also can be saved to memory and used in computations. A DSO combines the display of waveforms with data acquisition, archiving, measurement, and analysis.
Particularly for DSOs with long memories, algorithms have been developed to measure disk-drive performance, determine the values of various jitter components, and perform very specific communications channel measurements. Several manufacturers offer these special capabilities as options although sometimes a DSO is bundled with the algorithm software and sold as a distinct product.
A bundled product can offer an advantage by including special-purpose hardware that supports a more complete application solution. For example, the LeCroy SDA6000A XXL Serial Data Analyzer combines jitter measurement software with 100 MB of memory on each of two channels. Accuracy is improved in jitter measurements made on a single, very long acquisition because errors caused by a DSO�s internal trigger jitter are avoided.
In either bundled products or general-purpose DSOs, long memories can make all the difference although a short memory does not by itself cause aliasing. The problem arises when a slow time base is required for the display of a lengthy signal. Aliasing is caused by the reduced sampling rate associated with that time base. A long-memory DSO samples at a higher rate for a given time base speed, supporting a higher usable bandwidth.
With so many different DSOs available, the message is clear. Before you consider buying any test equipment, determine the real needs of your application.
Acquiring complex signals that are characterized by many thousands of cycles of activity requires long-memory DSOs. If, in addition, these signals contain high frequencies, the scope bandwidth and sample rate must be appropriate. And, if peculiarities of the signal make triggering difficult, special triggering capabilities also are needed. Unless your DSO provides all the required functionality, the solution to your application problem will be compromised.
FOR MORE INFORMATION on testing serial data streams
www.rsleads.com/407ee-183
July 2004
About the Author
Comment About the Article
To join the conversation, and become an exclusive member of Electronic Design, create an account today!

Leaders relevant to this article: