An oscilloscope is not a protocol analyzer, but it�s getting a lot closer.
As the eyes of the engineer, oscilloscopes are the key to meeting today�s demanding measurement challenges.1 This statement, originally written with waveforms in mind, still is true. Years ago, scopes primarily addressed questions such as �How high is the pulse overshoot? How wide is the modulation burst? Do the multiple faint traces imply metastability?�
Today�s DSOs continue to display waveforms although this function has been complemented by so many others that viewing signal characteristics is only one reason to use a scope. Modern DSOs serve in data-acquisition, process-monitoring, and signal-analysis roles among others. Against this background, it�s no wonder we received a wide range of replies from scope manufacturers in response to the question, �How do your company�s scopes help to pinpoint the source of an unknown problem?�
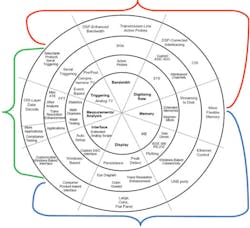
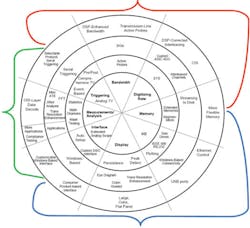
Help for the harried engineer was provided in a variety of ways as the DSO product matured. Starting with the innermost circle in Figure 1, the earliest DSOs digitized and stored waveforms. These early instruments were analog scopes with one or two ADCs and small memories. Of course, memory was expensive, and there were no field programmable gate arrays (FPGAs) and few ASICs at that time, so the amount of signal detail that could be stored and what you could do with stored traces were very limited.
Figure 1. DSO Development Timeline and Future Trends
Click here to see larger image
An ADC occupied a complete board of discrete circuitry in early DSOs, and most displays were electrostatic analog-scope CRTs. Nevertheless, the acquired waveforms simply remained as they had been captured for as long as required. That capability was a major breakthrough.
The concentric rings in the figure represent further refinements and additions that occurred over a 30-year period. Because so many technologies were developing simultaneously, each ring is only an approximation of the state of DSOs during a time span of several years. For example, LeCroy patented a form of DSP-based bandwidth enhancement before SiGe front-end circuitry was available. However, DSP-enhanced performance was not widely promoted until after SiGe ICs were used.
Initially, improvements were centered on making better digital oscilloscopes to rival the performance of analog scopes. Bandwidth gradually increased, and equivalent time sampling (ETS) was aggressively marketed as a way to overcome the low speeds of available ADCs. Similarly, emphasis was placed on measurements and analysis functions implemented in software.
The final section of the diagram shows a grouping of features into three distinct dimensions termed Physical-Layer Signal, Signal Expert, and Interface and Utilities. This grouping represents only my view of where scopes are headed, but it matches the manufacturers� descriptions of how their instruments �help to pinpoint the source of an unknown problem.�
Identifying a vendor with any of these dimensions is partly a matter of product positioning. For example, sufficient bandwidth always is needed to ensure good signal fidelity, but how much bandwidth is enough? If a new communications standard required 10 GHz, a scope with a 15-GHz bandwidth might be promoted on its superior speed. A 12-GHz model from another vendor might instead claim an automated compliance test routine that had been vetted by the appropriate standards body.
Beyond normal marketing efforts to differentiate similar products, there is a definite trend across the industry toward higher levels of abstraction. Canned compliance test routines, serial bus data decoding, and optional application-specific analysis routines are examples of the Signal Expert section. At the same time, semiconductor, circuit, and DSP-based enhancement advances in the Physical-Layer Signal segment have made possible outstanding channel response and more comprehensive triggering.
With a large number of programmable selections, very long memories, and optional test software, the man-machine interface and I/O capabilities also are under scrutiny. Efforts to make increasingly complex scopes easier to use at a high level without foregoing the opportunity for low-level control fall into the Interface and Utilities area.
The Physical-Layer Signal
How well does the waveform displayed on your scope represent the actual input signal? This is the $64,000 question for scope designers and buyers. The input attenuator, preamplifier, and ADC typically do a remarkably good job, and with a little number-crunching help from a DSP, near-ideal channel phase and gain characteristics are possible.
All scopes start at the Physical-Layer Signal level. Some manufacturers choose to emphasize the signal fidelity characteristics of their instruments above features such as analysis and memory length. Other companies� products also provide the necessary input channel performance, but applications such as compliance testing and serial bus protocol decoding may be the current marketing message focus.
�With bandwidths in excess of 80 GHz, sampling scopes are becoming more important tools for accurately assessing waveform quality,� said Greg LeCheminant, measurement applications specialist in the Agilent Technologies Design Verification Solutions Division. �Real-time oscilloscopes with much lower bandwidths may not provide an accurate representation of next-generation high-speed serial bus signals.
�However, it�s easy to fall prey to the notion that wider bandwidth will always yield a more accurate waveform. While a good -3-dB bandwidth specification is important,� he continued, �wide bandwidth with a poorly designed frequency response can yield a distorted waveform. A well-behaved frequency response is crucial to producing an accurate waveform although it seldom appears in the product specification.�
Adequate bandwidth is a prerequisite, but it�s the trigger that determines what portion of the signal will be captured. Because there are so many factors that can characterize a signal, scope manufacturers created palettes from which you could select rising or falling edge, level, slew rate, pulse width, glitch, and runt parameters on which to trigger. In the digital world, serial triggering allows you to address the large number of applications using serial buses such as CAN, I2C, SPI, and RS-232.
Often, a triggering sequence of an A state followed by a B state can be defined. Typically, A is the primary condition with full access to all types of triggering; B is secondary and more restricted. For example, B simply may provide a delay from the A condition. Tektronix�s pinpoint triggering supports an A followed by B sequence, but any type of trigger can be assigned to either A or B.
For engineers developing or troubleshooting video systems, Agilent�s DSO6000 Series Digitizing Oscilloscopes support analog high-definition TV/enhanced-definition TV (HDTV/EDTV) triggering for 1080i, 1080p, 720p, and 480p standards as well as video triggering on any line within a field, all lines, all fields, and odd or even fields for NTSC, SECAM, PAL, and PAL-M video signals.
For more general waveforms, you can find anomalies that fall outside of normal operating values by using exclusion triggering. LeCroy�s exclusion triggering may be applied to periodic waveforms such as clock signals or AC power line waveforms having a nominal shape that does not change with any regularity. After you have measured the normal range of timing for the signal, you can set up high/low limits for exclusion triggering. The scope will trigger only if the signal timing exceeds the limits.
Of course, having powerful trigger functionality and being able to use it easily are both necessary. Jim Gowgiel, representing worldwide design and manufacturing field marketing at Tektronix, commented on the company�s two-stage approach to identifying anomalous signal behavior. �The digital phosphor oscilloscope (DPO) technology provides rapid waveform capture rates simultaneously on all channels. This enables quick visualization of signal behavior and increases the probability of discovering infrequent faults. Once problems are identified, the appropriate trigger condition can be used to acquire relevant signal data for detailed measurement and analysis.�
Signal Expert
One of the earliest analysis functions provided by DSOs was the FFT. Today, jitter measurement is attracting a great deal of attention. Determining a signal�s jitter composition is done by analyzing the variation in signal edge placement compared to the ideal edge position. Long memories, high-speed sampling rates, and sophisticated algorithms are required.
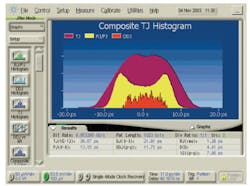
The Agilent Technologies 86100C Infiniium DCA-J Digital Communications Analyzer with jitter mode separates total jitter into random (RJ), deterministic (DJ), periodic (PJ), and sub-rate (SRJ) jitter components as well as intersymbol interference (ISI) and duty-cycle distortion (DCD) (Figure 2).
Mr. LeCheminant explained, �A significant source of frustration for high-speed designers has been that jitter tools rarely agreed with each other and for complicated signals often produced highly erroneous results. The 86100C provides an industry-standard reference receiver, a golden-PLL for jitter filtering, and built-in eye-mask test capability. The jitter measurement results were verified through work performed with a NIST-traceable precision jitter transmitter.�
With regard to LeCroy�s approach to jitter analysis, Mike Schnecker, the company�s product manager for high-performance scopes, commented, �Using the coherent interleaved sampling (CIS) technology, the WaveExpert Series Scopes capture serial data patterns up to 1-Mb long and separate correlated and uncorrelated jitter. The technique uses Q-scale analysis of the jitter histogram to accurately measure random jitter even in cases where there is crosstalk or other bounded, uncorrelated jitter sources. CIS provides the fast throughput needed to acquire the large statistical samples used in this type of analysis.�
To ensure that a balanced view of jitter has been presented, here is a comment from a non-scope manufacturer. According to SyntheSys Research�s Donna Leever, product marketing manager for the CR product line, serial data test specifications refer to jitter measurements from a bit error rate tester (BERT). �If your [error rate] is one in a thousand, use a scope. But, if it is one in a billion, then see it with a BERTScope�. Fast analysis will show the number of errors, where they occur, and if they occur periodically,� she explained. �The instrument supports troubleshooting to determine the bit pattern that caused the errors. In addition, eye diagram, contour, mask, Q-factor, and precision jitter measurements are available.�
The Signal Expert dimension includes not only basic analysis functions but also capabilities that require a stored reference or standard against which the acquired signal can be compared. A specific trigger condition is implied by the need for post-acquisition comparison, and measurements and analysis also are required. A good example is compliance testing of serial bus data.
For Agilent Infiniium 548xx, 8000, and 80000 Series Scopes, a number of serial bus tools are available as options�some that require additional hardware and some that don�t. In general, the user interface prompts and guides the user through all the steps needed for a successful test, even providing pictures of test setups. If a specific test pattern is needed, the software verifies that it is being generated by the DUT. Finally, HTML-based reports document the test thoroughly including the reporting of intermediate results. FibreChannel, PCI Express, Ethernet, USB 2.0, Serial ATA, serial-attached SCSI, HDMI, and DVI applications are supported.
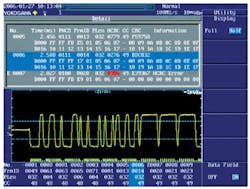
Separately, the Agilent 6000 Series DSO and MSO Scopes include I2C, SPI, LIN, CAN, and USB serial bus triggering as standard. Yokogawa�s DL7400 Series FlexRay Signal Analyzers specifically address Daimler Chrysler�s FlexRay bus standard, providing physical-layer signal observation and protocol analysis (Figure 3).
Beyond triggering on the packet content of CAN, I2C, and SPI serial data, the Tektronix DPO4000 also can decode each packet and display the value in either hex or binary on the bus waveform. Further, all decoded packets may be presented in a tabular view with timestamps. The Tektronix DPO7000 Series addresses USB 2.0 and Ethernet compliance testing as well as jitter and timing analysis, power measurement and analysis, and communications mask testing.
According to Tektronix� Mr. Gowgiel, �The DPOPWR Power Measurement and Analysis Software combined with a DPO7000 and differential voltage and current probes measures power loss at the switching device and magnetic component levels. Reliability at the component level of the switching power supply can be analyzed using safe area measurements, mask test capabilities, and the capability to measure the peak flux density.�
Automatic measurement of pulse-width modulated (PWM) voltage has been included in Fluke ScopeMeters. As explained by Fluke�s Hilton Hammond, product marketing specialist, �A pulse-width motor drive outputs a complex high-energy waveform that is composed of positive and negative pulses of various widths. The Vpwm automatic measurement mimics electric-motor characteristics to respond to the effective sine wave rather than only the peaks or rms value.�
RF measurements are supported by Agilent�s 89601A Vector Signal Analysis Software for Infiniium that enables flexible signal analysis and demodulation up to 1-GHz bandwidth. The solution provides demodulation for measuring constellation diagrams, carrier offset, and frequency error; spectrogram, phase vs. time, and frequency vs. time display formats; error vector magnitude measurements; and time gating to select a specific portion of signals for signal analysis.
|
FOR MORE INFORMATION |
| Agilent Technologies | 86100C Infiniium DCA-J Jitter Mode | www.rsleads.com/607ee-176 |
| B&K Precision | 5105B 150-MHz Scope | www.rsleads.com/607ee-177 |
| GaGe | CompuScope CS14200 | www.rsleads.com/607ee-178 |
| Fluke | ScopeMeter | www.rsleads.com/607ee-179 |
| LeCroy | WaveExpert Series Scopes | www.rsleads.com/607ee-180 |
| SyntheSys Research | BERTScope | www.rsleads.com/607ee-181 |
| Tektronix | DPO4000 Scope | www.rsleads.com/607ee-182 |
| Yokogawa Corp. of America | DL7400 FlexRay Analyzer | www.rsleads.com/607ee-183 |
Software routines are fine for post-acquisition analysis, but what about data monitoring or reduction processes performed at the full sampling rate? GaGe includes a high-density FPGA on new CompuScope digitizers. This hardware element can be programmed to perform signal averaging, FIR filtering, or peak detection on the fly.
Andrew Dawson, GaGe�s business development manager, described a recent peak-detection application. �A customer needed to acquire eight lightning test signals with as little re-arm time between them as possible. Four CompuScope CS14200 Digitizers were combined in a master-slave configuration giving eight 200-MS/s channels with 14-b resolution. On-board peak detection reduced the PCI-bus data transfer time to nearly zero from the 80% required had peak detection been done by the PC.�
Interfaces and Utilities
While it is true that scopes have developed many new, useful features, viewing displayed waveforms remains a primary instrument interface. Long memories and fast peak detect capabilities together with color grading and intelligent compression support traces with high information content. However, examining a large amount of acquired data in detail is a daunting prospect.
Recently, Tektronix introduced the DPO4000 Series with the Wave Inspector� feature. The Wave Inspector uses a special force-sensitive concentric control to facilitate zooming and panning through up to 10-MS data records. Events identified within the record can be marked and subsequently used as trigger conditions.
Agilent�s N5414A/15A InfiniiScan Event Identification Software augments a scope�s basic triggering and memory systems with additional searching, scanning, and measuring techniques. The software identifies slope reversals, measurements outside of limits, signals passing through or not passing through a predefined voltage/time zone, runts, and serial data patterns up to 80 b long. Because of its general-purpose nature, InfiniiScan has been grouped with other utilities rather than with more targeted Signal Expert tools.
Auto setup is a common utility that selects a vertical sensitivity and horizontal time base close enough to the optimum that an unknown signal is automatically displayed. Typically, it operates once when selected. According to Fluke�s Hilton Hammond, auto setup has been greatly enhanced. �The Fluke ScopeMeter� 190 Series Portable Oscilloscopes include a Connect-and-View� algorithm that continuously monitors the unknown input signal and automatically adjusts vertical sensitivity, horizontal timing, trigger position, and trigger timing to display a stable waveform. The mode is ideal for fast and easy checking of multiple test points.�
Modern scopes present many kinds of displays in addition to conventional waveforms. In particular, fast data acquisition and mapping modes, persisted traces with color or intensity grading, and overlaid history traces show variations within a collection of acquired waveforms in ways that appear similar; however, the differences are important.
Persistence is a display function that may be backed up by a collection of individual stored traces. If it is, then you can examine each trace to determine its effect on the overall presentation. For example, Agilent recently announced a mask-unfolding capability that allows you to determine the time of a signal when a mask failure occurred.
If persistence exists only as a displayed mapping of acquired data, you cannot assign anomalous features to one or more individual traces. The same is true of any mode such as Tektronix�s DPO mode that builds images without separately storing the actual acquired data. In the DPO mode, signals are acquired at a very fast update rate, which does help you to see transient anomalies that may be present. But, you trade off storing individual trace behavior to gain that capability.
Another way to start evaluating possible waveform anomalies was suggested by Dr. Mike Lauterbach, LeCroy�s director of product management: �Histicons are small-size versions of histograms that show the shape of the distribution for every parameter measurement the user has chosen. Parameter measurements are the most commonly used oscilloscope measurement tool, and a picture of the distribution can reveal competing processes in a circuit, sinusoidal interference pickup, random noise, and intermittent abnormal values.�
The capability to examine successive acquisitions is a popular tool offered under different names by several manufacturers. Simple memory segmentation predated these more sophisticated embodiments, but they all allow you to review waveform acquisitions as a sequential time history. In fact, Yokogawa calls its version History Memory.
�History Memory partitions the scope�s acquisition memory into hundreds or thousands of segments depending on the acquisition settings,� said Boyd Shaw, the company�s oscilloscope product manager. �Each segment stores a different triggered waveform and has a timestamp indicating when the trigger occurred. The waveforms can be viewed individually, replayed sequentially, analyzed, and saved.�
LeCroy calls its similar feature sequence mode. When replaying acquisitions on a WaveJet Series Scope, you can look in detail at accumulated persistence data by scrolling through one acquisition at a time. GaGe offers a multiple record capability on many of its PCI bus digitizers. For example, the 12-b CompuScope 12400 Digitizer supports up to 2 GS of on-board acquisition memory that can be segmented into acquisitions as short as 128 points each.
As well as being comprehensive, today�s scope interfaces can be customized. For users that perform many similar tasks or for production testing, Tektronix�s MyScope� control windows support building your own control windows with only the capabilities that you need for your job. Using a drag-and-drop process, you can make an unlimited number of custom control windows for different applications. The controls you need are found in one control window rather than having to access several menus.
Summary
There are far too many scope features available to list each one separately. Several have been discussed in detail with a view toward how they directly help you troubleshoot difficult problem waveforms. For example, jitter, serial bus, and power design are areas that have received special attention in the form of built-in and optional software packages.
One of the indirect benefits of so much scope product development is the large number of previously high-end features appearing in new, lower-priced models. Tektronix, Agilent, and LeCroy offer both a value scope portfolio as well as a performance category. Depending on the particular model, prices range from less than $1,000 to $14,000 in the value section and to greater than $100,000 in the performance group. Because of downward feature migration, it�s a good idea to thoroughly examine value scope specifications before deciding to purchase.
Of course, good performance at an attractive price isn�t limited to only a few companies. For example, the B&K Precision Model 5105B is a 150-MHz, dual-channel analog scope that also acquires signals at a 1-GS/s rate. Features include pre/post-trigger positioning; single-shot, refresh, average, envelope, roll, and peak-detect acquisition modes; a built-in RS-232 interface; 17 automatic measurements; and auto setup.
Many scope users are not familiar with a large percentage of newer capabilities. Clearly, some measurements may not suit your application, and compliance testing software is irrelevant for your transient capture job. But with the wealth of functionality economically available, you may find that better and faster test solutions now have become affordable.
Reference
1. XYZs of Oscilloscopes Primer, Tektronix, 2001.
July 2006
