Environmental testing determines how well products withstand the stresses likely to be experienced in normal use. Of course, you may need to know if a design will survive one event representing 10x the normal stress. This type of requirement arises in seismic testing of telecommunications racks. Because communications networks are critical to security and safety during emergencies, network operators must ensure that equipment will keep on working even after an earthquake.
At the other end of the spectrum, salt spray testing simulates the slow, long-term corrosive effects of various atmospheric impurities. This type of test underlines the importance of matching the test conditions to those of the actual use environment. The most recently developed salt-spray test plans are cyclical and include both dry and wet time periods. With the added dry periods, correlation to real corrosion is much better than in earlier test regimes that used a continuous spray.
Two actual applications help to demonstrate how a few types of tests are applied. In one example, transportation tests and packaging tests simulate the vibration and shock environment a product experiences during shipment to a customer rather than the stresses seen during normal use. Another facet of transportation-related testing involves a metal dust test specified by mass transit authorities and designed to simulate the contaminated atmosphere generated by the particles worn off metal wheels and rails and subway train brake pads.
Transportation Testing
You may have a truly innovative design with first-class manufacturing, and yet a large number of products are dead on arrival when the recipient opens the shipping box. It could be that the shock and vibration experienced in shipping far exceed the normal use levels that governed environmental testing during development. Transportation testing determines the effectiveness of the packaging you have provided and may identify weak areas of the product itself.
To be realistic, a test must duplicate the actual forces produced by a specific type of transport within a certain country; road surfaces do vary considerably from place to place. As seems logical, trucks with steel springs create a harsher vibration environment than ones with air springs. Rail cars generally have air springs and don’t hit potholes so this form of transport typically is less harsh than trucks. Air freight and ocean shipping are the least stressful.
A large number of surveys have been conducted to gather transportation acceleration data, which means that you don’t need to. Unless your shipment must travel a particularly arduous route, you can select a pre-existing power spectral density (PSD) curve that closely represents your transportation vibration environment.
Random Vibration
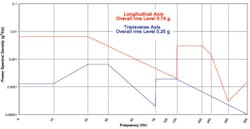
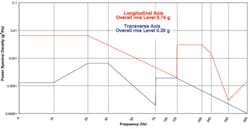
Figure 1 displays the basic transportation common carrier vibration environment PSD limits specified by MIL-STD-810 for the longitudinal and transverse directions. Tests typically run 60 minutes for each 1,000 miles simulated. Unfortunately, random vibration testing can under-represent infrequently occurring large shocks or bumps. Changing the distribution kurtosis can make the random vibration more realistic, or a separate test can be run on a bounce-testing machine in addition to shaker-based vibration testing.
We are constantly challenged to duplicate real-world environments and test for their effects on products.
Scott Poggi Retlif
Testing Laboratories
In the very early years of vibration testing before random vibration was used extensively, you could stress products only at one or a few frequencies at a time. The correlation between the type of vibration being applied in the lab and that seen in actual use was poor. Random vibration more closely represents the acceleration experienced by a vehicle on a real road, especially if the distribution kurtosis can be controlled.
Time Waveform Replication
A more direct approach reproduces the actual drive test forces. Time waveform replication is available from several shaker-controller manufacturers and can be based on either time-domain or frequency-domain techniques.
In the time domain, the shaker control signal is iterated to reduce the error between the simulated vibration and the recorded reference signal. This control signal is saved to memory and then used to drive the test setup. The frequency-domain method does not require initial iteration and can accommodate changing system dynamics during the test.
In both cases, the inverse system transfer function must be estimated. According to a technical paper from Data Physics, this is accomplished by driving all system axes with band-limited uncorrelated random noise and recording the outputs of the various control channels. The inverse of the resulting frequency response function (FRF) matrix [H] is then found [H]-1.
The frequency-domain approach “uses an FFT to convert a reference time-history frame to the frequency domain, and this is multiplied by [H]-1 to produce the drive signal. An inverse FFT generates the drive time-history frame. This is done for each frame in the reference time history.
“The drive and control signals are recorded to calculate a new [H] matrix during the iteration phase. A new [H]-1 matrix is calculated and…can be used for real-time correction of the drive signals by measuring and updating the FRF matrix…. This allows continuous convolution of the time-history signals with the inverse of the system dynamic response.”1
Time-domain-based replication starts in the same way but directly compares the generated and reference time-domain signals without recalculating [H]-1. Through an iterative process, one overall drive signal is developed, stored, and used throughout the testing. This means that if the shaker impedance changes because of temperature effects during a long test or if the system FRF is altered for any other reason, the drive signal is not adjusted accordingly. In addition, the initial iteration required to develop the drive signal can be time-consuming.
Testing a Large Filter Assembly
Sheldon Levine, vice president of marketing and business development at Aero Nav Laboratories, described transportation testing performed on a large filter assembly. “During ground transportation, equipment is subjected to broadband random vibration and shock loading resulting from the interaction of the transport vehicle and the road surfaces. The road-surface effects are functions of its condition and the presence of discontinuities such as cracks and potholes.
“Shakers used for transportation testing are designed to meet standards such as MIL-STD-810, ASTM STD D999, and MIL-STD-3311. The test parameters in these specifications are based on actual test data obtained on representative common carriers. The data is presented graphically as PSD (g2 /Hz),” he said.
Bounce Testing
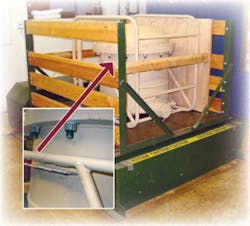
“In addition to random vibration,” Mr. Levine explained, “bounce testing is performed to replicate the shock conditions encountered during equipment shipment. Bounce testing is completed on machines specifically designed for that purpose. Figure 2 shows the filter positioned within restraining fences attached to the machine’s mounting platform. Bounce machines are mechanically driven by the use of cam mechanisms at the four corners of the unit. They are not programmable but can be set to generate vertical and elliptical platform motions.”
During the filter test, the machine was run for 1½ hours with the filter positioned on the platform. Then, the filter assembly was repositioned 90 degrees, and the machine was again run for 1½ hours. Repositioning is necessary on this type of bounce machine because the mechanical linkages are driven by cams on shafts running the length of the platform. The resulting motion is mainly in two dimensions. Repositioning subjects the filter to forces in the third direction.
This test simulates the treatment a product might receive if loaded into the back of a pickup truck for delivery. The bounce machine operating manual suggests starting the test at a slow speed and small displacement, gradually working up to the point at which you can slide a 1/32″ thick piece of material under the bouncing object. This confirms that there is at least 1/32″ of separation occurring, which is “adequate for normal preshipment testing of commercial products,” according to L.A.B. Equipment information.
The Figure 2 inset shows the broken weld that resulted from the bounce test. Clearly, a better way will need to be found to attach the tubular frame to the filter body. Of all the testing machines in the Aero Nav labs, Mr. Levine noted, the bounce testing machine often inflicts the most damage, a testament to the severity of a seemingly simple test.
Information on the National Technical Systems website provides additional background: “Shipping containers carrying military and civilian hardware often spend a considerable amount of time in the back of transport trucks. When the cargo travels off-road being delivered to remote fields of operation, the ride can be quite rough. Items that see rough road duty may be encased telephones, laptops, missiles, or medical equipment, and regardless of the journey, the gear has to work upon arrival.
“The military designed the loose cargo test section in MIL-STD-810 to simulate the motion of an unrestrained container as it repeatedly collides with the walls and floor of a four-sided enclosure and other cargo in a semi-elliptical trajectory. This test usually runs for 45 minutes and simulates approximately 150 miles of transport. This process requires a special, low-rpm, low-frequency (5 Hz), and small-displacement (1 inch) test bed package tester.
ISTA
“The International Safe Transit Association (ISTA) developed civilian package test procedures resembling the military test: 1A for products weighing less than 150 lb and 1B for over 150 lb. Additional tests in subsequent procedures such as 1C, 1D, and 2A combine the loose cargo basic test with atmospheric conditioning and other factors.”
Including this organization in your search for transportation and packaging test procedures is a must. A large number of test profiles have been developed that correlate well to actual transport environments and are recognized by international standards bodies. This material is available online at www.ista.org .
Subway Train Residue Testing
Recently, Retlif Testing Laboratories was approached by New York City Transit, part of the Metropolitan Transportation Authority, to simulate the metal dust environment present in underground subways and relay rooms. These rooms house communications and signaling equipment linking the switch machines, signals, power junction boxes, control towers, and numerous other components on the tracks or at trackside.
Scott Poggi, technical coordinator for the lab’s environmental testing services, explained, “We are constantly challenged to duplicate real-world environments and test for their effects on products. The purpose of this test is to verify the performance, reliability, and maintainability of the subway equipment and measure the effects due to abrasion of the outer casing, clogging of cooling and ventilation ports, or inadvertent conduction of electrical connections on internal circuit boards.
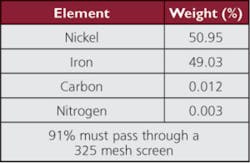
“The metal dust particulate size varies from 1 to 650 microns in diameter. The test dust is an iron-based specialty powder, trade named Ametek PN F50, composed of nickel, iron, carbon, and nitrogen in the proportions by weight shown in Table 1. All of these materials are found either on the train tracks or in the wheels or brake pads of the subway car’s traction motors.”
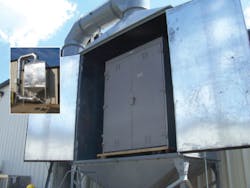
To perform testing to satisfy the New York City Transit Specification Section 17S: Environmental Testing Requirements for Signal Equipment, Retlif needed to construct a 4′ x 8′ x 8′ test chamber large enough to accommodate most transit equipment cabinets (Figure 3 inset). The chamber can circulate the metal dust to 1,500 fpm and, with minor modifications, as high as 5,700 fpm. The dust injection port allows a measured amount of dust to be injected directly into the air stream.
At the start of the test, the EUT is visually inspected and verified to operate within its performance specifications. The EUT then is placed into the test chamber as it would be in its normal field configuration with the top of the EUT facing the metal dust injection port (Figure 3). The EUT must be positioned as near to the center of the chamber as is possible, allowing a minimum of six inches to all of the chamber walls to ensure proper airflow. All cabling is connected to the EUT in a manner to represent the actual installation as closely as practical.
The chamber then is sealed and the EUT allowed to stabilize at room ambient temperature and humidity conditions. Once stabilization has occurred, the air velocity of the chamber is increased and adjusted as specified to between 295 fpm and 1,500 fpm. The metal-dust feed then is adjusted to the required concentration of 0.300 g/cubic meter. The chamber velocity and dust concentration are monitored and maintained for 24 hours.
At the end of the 24-hour exposure, the chamber is de-energized and the EUT removed and visually inspected. A dielectric withstand voltage test is executed immediately to verify no conduction failure of the internal parts. Once this test is completed, a full performance test is performed.
While the technology and design of this chamber obviously are rooted in traditional sand and dust testing, this is an example of how specialized test chambers and test methods can be developed to address specific needs within an industry sector.
Conclusion
Although the equipment you may need to perform certain types of environmental testing can be very specialized, such as the Retlif metal-dust chamber, the test objectives are easily expressed: The goal is to simulate conditions representative of those the EUT will experience in actual use. And, as the Aero Nav example illustrates, use often includes transportation.
Reference
1. Reilly, T., “Time Domain and Frequency Domain Techniques for Multi-Shaker Time Waveform Replication,” Data Physics.
| FOR MORE INFORMATION | Click below | |
| Aero Nav Laboratories | Bounce Testing | Click here |
| Data Physics | Vibration Controllers | Click here |
| ISTA | Transportation Test Procedures | Click here |
| L.A.B. Equipment | Bounce Test Machines | Click here |
| National Technical Systems | Transportation Testing | Click here |
| Retlif Testing Laboratories | Metal Dust Testing | Click here |
March 2010
