Build Your Own IR Windshield Rain Sensor

Download this article in PDF format.
In this article, we implement a rain and ice sensor by analyzing the reflection of an infrared (IR) light source. This project uses proven techniques based on multiple reflections of IR light in the internal walls of the target glass. It will aim to increase the capabilities of standard components by adding technical advantages offered by the LED device, such as increasing the power emission using pulsed energy applied 10 times using high current strikes at a 1% duty cycle.
Application
The most common practice in the detection of raindrops on a windshield involves sensing infrared light conducted through the internal walls of the windshield glass (Fig. 1). In some cases, these reflections are enhanced by adding other physical components to the glass.
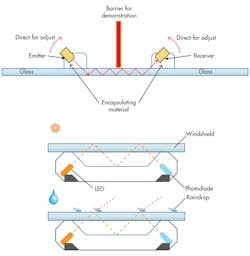
1. Internal reflection principle used in the most common rain sensors.1
When raindrops are present on the external surface of the glass, a refraction of light happens and takes away part of the initial light stream. This results in an attenuated beam of IR light as compared to the original conditions (without the presence of water).
In order to acquire the majority of the luminous emissions, the light beam is injected to the glass at a 45-deg. angle. The receiver at the other end of the glass also has a 45-deg. angle. This technique depends on the statistical probability that when it’s raining, the surface of the glass will have raindrops in the path of reflection. As the distance between emitter and receiver lengthens, the detection method becomes more effective.
In addition, as the distance between emitter and receiver grows, the light’s power loss increases as the light travels through the glass. For the best detection, given increasing distance, either a more efficient sensing/light emission device must be developed, or more power must be obtained from the current IR light source.
This application suggests a method to wring the most out of the LED. A constant light could be used for measuring, but it’s not mandatory because the time constant isn’t our priority (rather, it’s measuring the intensity of the beam). Fortunately, LED manufacturers supply the peak forward current2 (IFP) or the forward surge current3 (IFSM) of the LED in their datasheets.
GreenPAK Design
Pulse generator for IR emitter
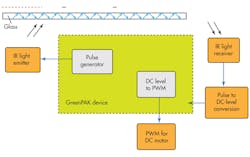
2. General block diagram of GreenPAK design.
For the pulse generator in the block diagram of the GreenPAK design (Fig. 2), we’ll use 10 μs with a 1% duty cycle. The complete period is given by:
T min = (MaxPulseH/MaxDCycle) = (10 µs/1%)
T min = 1 ms
That results in a maximum frequency of:
F_max = (1/T) = 1 kHz
Thus, a HIGH pulse is set for 10 μs with the complementary LOW level to achieve a 1-ms total period. To generate this pulse, we’ll use CNT5/DLY5 and CNT2/DLY2.
CNT5/DLY5 provides the complete period of 1 ms. It’s set as a counter using the internal clock at 25 kHz (configured in OSC). CNT2 provides the 10-μs HIGH level pulse.
IR LED emitter driver
A basic configuration (Fig. 3) is used to drive the IR LED—it employs TIP121 transistors and takes into consideration the power-supply conditions of a car, where +12 V is the main voltage source.
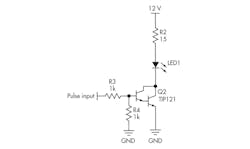
3. IR LED driving circuit.
Based on experience, the TIP121 Darlington transistor is a good option for this application. This device will allow us to drive a high current load with a low base current.
Therefore, R1 can be calculated from:
IF = (VDD – VF – VCEsat)/R1
R1 = (12 V – 2 V – 2 V)/0.5 A
R1 = 16 Ω
The average power calculation for R1 is calculated as follows:
PR1 = IR12 × R1 × DutyCycle
PR1−16Ω = 0.5 A2 × 16 Ω × 1% = 40 mW
In order to be aware of the worst-case conditions, there’s a possibility that the signal in the base of Q1 could be a constant dc level. If so, the power dissipated by R1 is as follows:
PR1−15Ω = 500 mA2 × 16 Ω × 100% = 4 W
The power dissipated by the Darlington transistor must be observed (to take care of the device’s lifespan) by calculating the device temperature through its thermal resistance parameters.
At 25°C, with no additional heat sink:
TQ1−amb25 = PQ1 × RθJA + Tamb
TQ1−amb25 = 40 mW × 62.5°C/W + 25°C
TQ1−amb25 = 27.5°C
This does not seem like a big issue. However, in the case when current driven is 100%:
TQ1−amb25 = 4 W × 62.5°C/W + 25°C
TQ1−amb25 = 275°C
This means it would be beneficial to avoid a constant level in the base of Q1.
One simple option is to have a series capacitor in the base (Fig. 4).
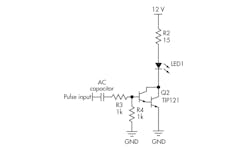
4. IR LED driving circuit with decoupling capacitor to avoid dc levels.
IR light receiver
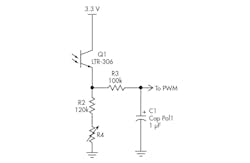
The receiver is configured as a common collector that simply converts the input light pulses into a voltage in R2 (Fig. 5). The voltage drop in R2 will typically be in the form of pulses. For our purposes, these need to be translated into a dc level.
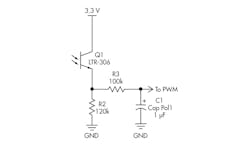
5. IR receiver circuit plus low-pass filter.
The easiest way to do this is to filter the signal using an RC low-pass filter, with a cutoff frequency two decades before 1 kHz (therefore, 1 Hz) to ensure the 1-kHz rejection. The cutoff frequency is calculated as:
FC = [1/(2 × πRC)]
If a 100-kΩ resistor is used:
C = [1/(2 × π × 100 kΩ × 1 Hz)]
C = 0.795 µF
We can try for 1 μF, resulting in a cut-off frequency of:
FC = 1.59 Hz
Voltage-Controlled PWM
To achieve the intended goal of this article, we’ll refer to the AN-1056 Macro circuit design ADC PWM application note to translate a dc level into a pulse-width-modulation (PWM) signal (Fig. 6).
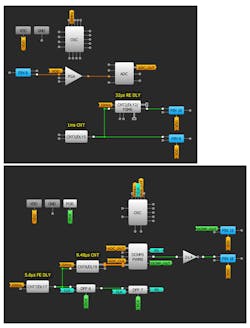
6. Array to create a PWM signal based in a dc level.
Measurements
IR light emitter vs. IR receiver
Figure 7 reveals results from testing the IR light emitter versus IR receiver. The oscilloscope screen captures depict the IR LED pulses (CH1) versus the voltage drop in R2 directly from the IR receiver (CH2). In Fig. 7a, one can see R2’s voltage (CH2) versus the filtered dc level in C1 (CH1).
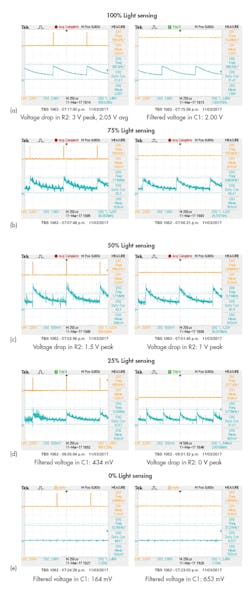
7. Screen captures showing IR light emitter versus IR receiver testing: Voltage drop in R2: 3 V peak, 2.05 V avg, and filtered voltage in C1: 2.00 V (a); TK (b); voltage drop in R2: 1.5 V peak, and filtered voltage in C1: 653 mV (c); voltage drop in R2: 1 V peak, and filtered voltage in C1: 434 mV (d); voltage drop in R2: 0 V peak, and filtered voltage in C1: 164 mV (e).
Figure 8 provides screen captures that show dc level vs. PWM.
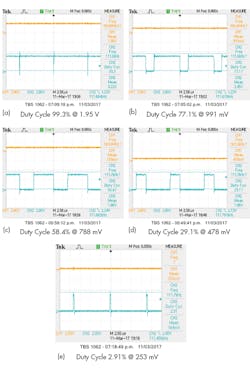
8. Screen captures showing dc level vs. PWM: Duty cycle 99.3% @ 1.95 V (a); duty cycle 77.1% @ 991 mV (b); duty cycle 58.4% @ 788 mV (c); duty cycle 29.1% @ 478 mV (d); duty cycle 2.91% @ 253 mV (e).
Ice-Sensing Applications
During this exercise, we found that sensing ice is somewhat challenging using the techniques described so far. The changes in refraction due to the presence of ice are different than changes due to the presence of water. However, it’s possible to detect both.
We recommend that the emitter and receiver be immersed in a clear encapsulating material so that the light emitted and received isn’t lost due to material changes. This helps avoid unintended attenuation, and helps prevent a false positive in which condensation on the inside of the car sets off the rain sensor.
We can account for the added challenge of detecting ice by adding a barrier to the center and adjusting the angle of the emitter and receiver.
Circuit Enhancement
This section discusses how to enhance the receiver to deal with the challenge posed by an icy windshield. The previous receiver design was shown in Fig. 5. The low-pass filter with R3 and C1 was optimized for water-only sensing.
9. R4 is added to avoid high current drain from Q1.
To account for the change in the angle of reflection and the presence of encapsulating material, we can change the value of R2. The gain of the circuit is directly proportional to R2’s value. For practical purposes, a 500-kΩ potentiometer would be ideal to select the proper value for the circuit. Figure 9 shows an updated topology with the potentiometer included.
The waveforms in Figure 10 show the different behaviors of the circuit with varying conditions.
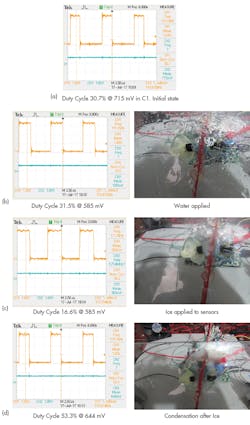
10 Waveforms showing circuit behavior under different conditions: Duty cycle 30.7% @ 715 mV in C1 (initial state) (a); duty cycle 31.5% @ 585 mV with water applied (b); duty cycle 16.6% @ 585 mV with ice applied to sensors (c); duty cycle 53.3% @ 644 mV with condensation after ice (d).
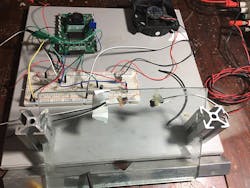
Conclusion
In this article, we were able to create a rain and ice sensor using a Dialog Semiconductor GreenPAK SLG46620, a configurable mixed-signal IC (CMIC), and a few external components. This system is able to monitor when a sheet of glass has either water or ice on its surface. The system can then generate a PWM signal to control a motor that wipes away the liquid from the glass surface. Here's a picture of the setup:
Tuning and Troubleshooting Notes:
If the output of the voltage is low for the circuit in Fig. 5, increase R2.
If the light emitted by the circuit in Fig. 4 is not as powerful as expected, check the connections between R2, LED1, and Q2. You can verify the voltage drops for each component.
References:
1. https://en.wikipedia.org/wiki/Rain_sensor
2. http://www.everlight.com/file/ProductFile/HIR928-6C-F.pdf

About the Author
Jorge Martinez
Electronic Engineer
Jorge Martinez, born in September 1973, graduated from ITSLP (Mexico) in 1995 as an Industrial Engineer on Electronics. His experience involves 13 years in hardware electronics development covering telecommunications, power metering, appliances, and motor control, performing component selection, electronics design, and leading on PCB layout oriented to EMC. Jorge also has seven years of experience in the automotive and aerospace industries as a test process engineer and project manager.
His design focus is oriented toward simplicity, a similar philosophy of those like the late National Instruments engineer Bob Pease. Jorge has interacted and worked in joint projects with interdisciplinary teams in the U.S., China, Germany, Switzerland, Poland, and Hungary.
He enjoys the musical arts of singing and playing Latin-American folk guitar.
Comment About the Article
To join the conversation, and become an exclusive member of Electronic Design, create an account today!

Leaders relevant to this article: