Memory Market Holds Key to Semiconductor Forecast
This file type includes high-resolution graphics and schematics when applicable.
A semiconductor forecast has two parts—supply and demand. Now that some demand drivers have been highlighted (see “An Objective Analysis on the Industry Outlook for 2016”), the supply side of the equation will be inspected, listing some of the factors that influence chip supply.
How Suppliers Match Demand Growth
Demand for semiconductors grows pretty steadily. New and more demanding applications team up with expanding markets to drive a continually increasing demand for transistors.
Chip suppliers use two tools to match their output to this growth: They produce more wafers and squeeze more transistors onto each wafer. More wafers can be produced by adding manufacturing capacity, which only takes money—also known as capital spending, capital expenditure, or CapEx. It’s more difficult to fit a steadily increasing number of transistors onto a wafer. In general, process shrinks do the trick, as embodied in Moore's Law. This takes a lot of R&D, and it adds to the capital spending requirements since new tools must be incorporated to achieve the finer parts of the new process.
Advancement of either of these tools can move too quickly, resulting in an oversupply of output, or too slowly, which creates a shortage. Most of the past several cycles have been driven by too much or too little capital spending, so CapEx deserves a review.
CapEx Drives Most Semiconductor Cycles
Despite some conventional "wisdom," semiconductor cycles are still strong. The key to delivering a good forecast is to understand when and how the industry will undergo supply/demand mismatches, and comprehend what will result from the transition into and out of an oversupply.
During a typical semiconductor cycle, CapEx in one year drives a shortage or an oversupply two years down the road. Most of the swing comes from the memory sector, which is an undifferentiated commodity with a high capital intensity. That's economist jargon for the facts that:
• Nobody really cares whose DRAM or NAND flash they buy, as long as it's cheap.
• Memory fabs (wafer-fabrication plants) cost $8-10 billion to build and equip.
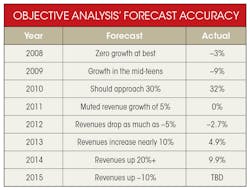
Objective Analysis relies heavily on CapEx to predict how the semiconductor market will behave. This has led to a consistent level of accuracy in our forecasts as shown over the past eight years (see table). These forecasts, given at the end of the preceding year, were very close to the actual outcome.
Each of these forecasts was modeled with a focus on capital spending, without trying to predict macroeconomic phenomena. The global financial collapse in late 2008 created a demand lapse in the first quarter of 2009 that this methodology could not anticipate, resulting in the one year that the Objective Analysis forecast was significantly in error. Such demand reductions are rare, having only occurred in 2001 (Internet bubble burst), 1985 (PC demand collapse), and 1975. The global financial meltdown caught everyone in the developed world by surprise, not just semiconductors.
It appears that our prediction of roughly 10% growth in 2015 was also hit by a minor demand lull, but not enough of one to make the DRAM market unprofitable. Late in 2015, the year seemed poised to have zero growth, stemming from a mild oversupply driven by smartphone and PC sales that fell below predictions.
Objective Analysis is proud of its forecast track record. Our high degree of accuracy stems from a sound methodology that takes into account a number of critical factors and embodies them in a field-proven model. The net result is a forecast based on science, rather than art, leading to the most consistently accurate forecast in the industry.
This year, the role CapEx plays on the semiconductor outlook is different, as will be explained.
3D NAND and Moore's Stall
As mentioned, increasing the number of transistors per wafer is one way that semiconductor makers match output to demand. That can cause issues, though.
Since semiconductor makers plan to match demand growth through both increased wafer starts and increased transistors per wafer, then a shortage can stem from a delay in a producer’s ability to increase the number of transistors they can print onto a wafer. This doesn't happen very often, but when it does, it's a headache. On the other hand, there’s no case where the transistor count increased too rapidly to cause an oversupply.
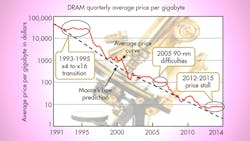
The graph provides a good illustration of the results of such delays (see figure). It charts DRAM average cost per gigabyte from 1991 through 2014. DRAM is used because it provides a very simple picture: DRAM's production cost generally follows a Moore's Law trend, decreasing at an average annual rate of 32%. DRAM is also a good proxy for NAND flash, since both are commodity memory chips, and trends are likely to recur in both markets.
Prices flatten during a shortage, collapse to cost at the onset of an oversupply, and then follow the cost curve until the next shortage develops. Three periods of extended stable pricing have been circled in the chart:
1. The 1992-1995 shortage that was caused by the conversion of DRAM interfaces from 4 bits to 8- and 16-bit widths.
2. The 2003-2006 shortage was protracted by a full year from difficulties migrating to the 90-nm process node. No prior process migration caused so many problems for the industry.
3. Prices flatten from mid-2012 until the end of 2014. If 2015 prices were added to this chart, there would have been an important price fall in the second half of 2015. However, prices would still be above the cost line similar to what is seen in 2004.
Note that each of the first two periods of flat pricing were extended by a single difficulty that caused DRAM supply to fall short of demand. Each of these single difficulties lengthened an existing shortage by one to one and a half years.
The graph reveals the future of NAND flash. Currently, NAND flash faces a dozen or more new and significant changes that will stall its migration from planar to 3D volume production. This will not cause a 12-year delay, but will cause delays of over one year and result in shortages. As semiconductor process technology approaches the physical limits of atoms, more of these "Moore's Stalls" will delay or halt the ability to shrink transistors.
Until every single one of these dozen changes has been solved, NAND will end up in a shortage that will become more severe. As this plays out, some DRAM capacity is likely to be temporarily converted to NAND flash production, which will cause a companion DRAM shortage. Prices for both will flatten, with DRAM bit shipments increasing about 20%, and NAND flash bit shipments growing about 35% in 2016. Revenues are the product of these flat prices and growing bit consumption, resulting in memories undergoing 14% revenue growth over the course of 2016.
As always occurs, the swings in memory will drive a smaller semiconductor market swing, giving the overall semiconductor market a growth rate approaching 10% in 2016.
Happy New Year 2016
Semiconductor revenues in 2015 trailed off in the second half, and 2016 is likely to continue to be very volatile, with worldwide economic conditions being an aggravating factor. Many applications, like automotive and imaging, should keep electronics a vibrant market. However, an eye should be kept on unsustainable overcrowding in the exuberant IoT markets while trying to understand what’s really happening in China as both a market and a producer.
Further elaboration of the topics in this article can be found in an extended paper found on the Objective Analysis website.
About the Author

Tom Starnes
Analyst
Tom Starnes is arguably the best-known embedded processor analyst in the semiconductor industry. Covering a range of products, Starnes' insight, coupled with his no-nonsense approach to processor and end-use analysis has led to his becoming one of the most sought-after consultants in the world of processors. It is through his hard-hitting insights that many key players in this industry have found their focus and refined their product strategies.


