Data Visualization Helps Make Wise Energy Choices
The idea is simple: Show people real-time household energy usage, along with usage history, so they can make informed decisions about when to use appliances. This lets a consumer decide, for example, whether to delay the start of a dishwasher so it runs when utility costs are low. In that regard, the Consumer Electronics Show (CES) held in January witnessed the display by General Electric (GE) of several new “ecomagination” products focusing on ways consumers can more efficiently use energy.
One of those products, Nucleus, is a home energy hub that connects devices such as appliances to smart meters and zooms in on consumption habits. Nucleus shows real-time (kW) and long-term (kWh) data on power consumption and reveals historical trends over as much as three years.
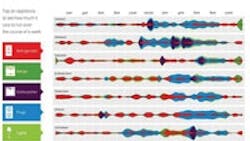
In conjunction with Nucleus, GE is developing a line of smart appliances with what it calls Brillion technology. Brillion's strong suit is the way it lets consumers visualize energy consumption data. Brillion technology lets consumers access smart-meter-enabled appliances via computer or mobile device. The visualization was originally developed as a touchscreen application but now it can be had as a Web version to show how appliances in a sample home consumed energy over the course of a month. To generate the data, GE tracked five major sources of kitchen energy use — refrigerator, range, dishwasher, wall plugs, and lighting — in a typical American household for one month.
For more information, visit http://www.gereports.com/ben-frys-powering-the-kitchen-data-viz-debuts-at-ces-2011/
