Simple Yet Robust Triboelectric Harvester Powers Sweat-Sensing Patch
What you'll learn:
- How a Caltech team created a wearable sweat sensor using flexible circuit boards.
- Materials involved in creating the energy-harvesting sensor.
It’s not news that you can use the triboelectric effect—electricity generated by the friction of motion between two suitable materials—to generate tiny but useful amounts of energy to power body-mounted devices and their sensors. However, many of these energy harvesters require complex fabrication steps and lack ruggedness or flexibility for normal body wear and normal associated normal wear.
Now, a team at the California Institute of Technology (Caltech) has developed a wearable sweat sensor that’s powered by a simple-to-fabricate triboelectric harvester, which is based on a thin sandwich of materials (Teflon, copper, and polyimide) attached to the person's skin. As the person moves, these sheets of material rub against a sliding layer made of copper and polyimide to generate small amounts of electricity.
What is new, noted Wei Gao, assistant professor of medical engineering in the Andrew and Peggy Cherng Department of Medical Engineering and project leader, is how the research team manufactured the nanogenerator. “This is not something new, concept-wise. But instead of using fancy materials, we use commercially available flexible circuit boards," he said. "This material is cheap and very durable and mechanically robust over long periods of time."
Why focus on sweat? The researchers note that sweat is an attractive and accessible medium with many molecular biomarkers including electrolytes, metabolites, amino acids, hormones, and drugs that wearable sensors can analyze. Dubbed a freestanding triboelectric nanogenerator (FTENG)-powered wearable sweat sensor system (FWS3), this integrated unit reports its data wirelessly via a low-power Bluetooth link, eliminating the need for a connector and the many issues that would add to the design.
The project resulted in a highly robust, mass-producible, and battery-free wearable platform that efficiently extracts power from body motion through the FTENG-based, flexible printed-circuit board (FPCB). The completed unit is an efficient, wearable, low-power wireless sensor circuitry plus a microfluidic sweat sensor patch on a single FPCB platform that can dynamically monitor key sweat biomarkers such as pH and Na+, and generate a relatively high power output of about 416 mW/m2 (Fig. 1).
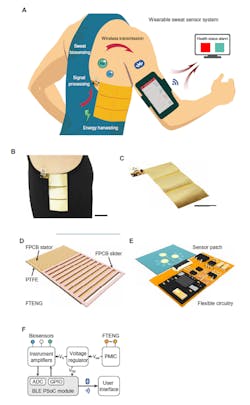
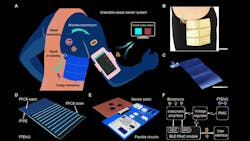
1. Battery-free FWS3 for wireless and noninvasive molecular monitoring. (A) Schematic illustrating the FWS3 that integrates human motion energy harvesting, signal processing, microfluidic-based sweat biosensing, and Bluetooth-based wireless data transmission to a mobile user interface for real-time health status tracking. (B and C) Optical images of an FPCB-based FWS3, which can be worn on a human side torso. Scale bars, 4 cm. (D) Schematic diagram of the FPCB-based FTENG with a grating slider and an interdigital stator. (E) Schematic diagram of the FWS3 showing a microfluidic-based sweat sensor patch interfacing with the flexible circuitry. (F) System-level block diagram showing the power management, signal transduction, processing, and wireless transmission of the FWS3 from the FTENG to the biosensors, then to the user interface. (Source: Yu Song, California Institute of Technology)
To fabricate the FTENG, the team used a series of steps similar to PCB fabrication to create the solder, using electroless nickel/immersion gold (ENIG) deposition plus a polytetra-fluoroethylene (PTFE – Teflon) coating for the stator (Fig. 2). The rectangular interdigitated slider (44 × 42 mm) has 10 “digits,” while the stator (60 × 38 mm) has 15.
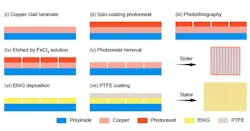
2. Fabrication process of the slider and the stator of the FTENG. Steps (i-vi) are compatible to the commercial FPCB fabrication process. (Source: California Institute of Technology)
Output of the FTENG was modeled and measured on the bench under multiple scenarios; Figure 3 shows data extracted from one such run.
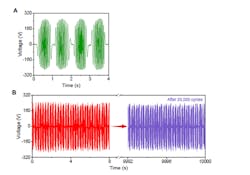
3. Output performance of the FTENG. (A) Waveforms of output voltages of an FTENG under a working frequency of 0.5 Hz. (B) Cycling stability of output performance of a FTENG after 20,000 cycles under a working frequency of 2 Hz. (Source: California Institute of Technology)
The schematic diagram of the circuit and the high-level flow chart of the operating firmware shows the interconnection and interplay among the many elements (Fig. 4).
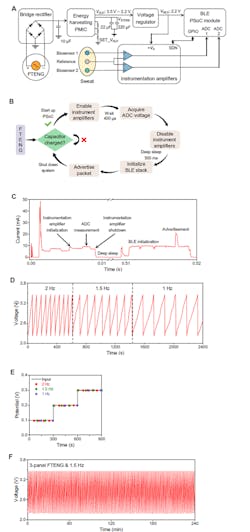
4. System-level integration and evaluation of the FWS3. (A) Schematic diagram of the battery-free FWS3 consisting of an FTENG module, a biosensor interface, instrumentation amplifiers, an energy-harvesting PMIC, a voltage regulator, and a BLE PSoC module. (B) Operation flow of the FWS3 with signal processing and data transmission. (C) Power consumption of the FWS3 during the operation. (D) Real-time potential of the capacitor (242 µF) during the continuous operation of the FWS3 with a three-panel FTENG under different working frequencies. (E) Validation of data transmission from an FWS3 with a three-panel FTENG under different working frequencies. (F) Long-term stability of the capacitor charging process when an FWS3 operates under a working frequency of 1.5 Hz. (Source: California Institute of Technology)
In addition to physical and electrical modeling and bench tests, the project team did evaluations with live subjects to validate the results and enhance the project credibility (Fig. 5).

5. On-body evaluation of the FWS3 for wireless, dynamic perspiration analysis. (A) Output waveforms of a six-panel FPCB-based FTENG during various exercises. (B and C) Real-time potential of the capacitor charged by an FTENG (B) and the average charging time for each package transmission (C) when a subject is running on a treadmill for 1 hour at a constant speed of 9 km/hour. The ratio in (C) represents the percentage of charging cycles (with charging duration within a given time range) out of all the charging cycles. When the potential reaches 3.3 V, the capacitor is discharged due to the Bluetooth Low Energy (BLE) data transmission. (D) Optical image of a subject on a treadmill wearing an FWS3 and a mobile phone. (E) Real-time sweat pH and Na+ levels are obtained wirelessly from the wearable system charged by a lithium battery and by an FTENG during constant-speed running. (Source: Yu Song, California Institute of Technology.
A description of the rationale, various stages, and results of this multidisciplinary project can be found in an 11-page, readable paper published in the journal Science Advances, “Wireless battery-free wearable sweat sensor powered by human motion.” It’s accompanied by a 38-page Supplementary Materials paper that provides additional details on fabrication, arrangement, and test.