Graphene “Tattoo” Delivers Continuous Blood-Pressure Monitoring

What you’ll learn:
- How graphene-based e-tattoos can be used for bioimpedance measurements.
- How these measurements translate to blood-pressure readings.
- The results of the system based on e-tattoos, electronics, and machine learning.
A blood-pressure (BP) reading is among the most important indicators of heart and overall health, but it's difficult to measure continuously. While wrist-based smartwatches seem to offer a solution, they can’t provide consistent, accurate results because these watches slide around on the wrist and may be far from arteries.
As a result, traditional cuff-based devices that constrict around the arm to give a reading are the accepted standard. Still, the ability to provide constant monitoring of pressure and its variations would be very useful for immediate and predictive health analysis.
Now, researchers at Texas A&M University and The University of Texas at Austin have devised, built, and tested (admittedly on a limited group) an approach that enables continuous non-invasive monitoring. It also provides a more comprehensive look at blood pressure than the single snapshot that comes with the cuff approach.
Their graphene-based electronic tattoo (dubbed GETs) can be worn comfortably on the wrist for hours and deliver continuous blood-pressure measurements at an accuracy level that exceeds nearly all available options on the market today. The continuous monitoring by the e-tattoo allows for blood-pressure measurements in all kinds of situations, including at times of high stress, sleeping, and exercising (Fig. 1).
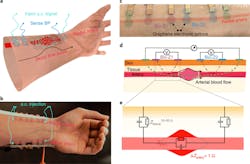
1. Illustration of Z-BP measurement modality: (a) Three-dimensional schematic of the GETs placed onto the participant’s wrist over the radial artery, with two outer tattoos used for ac injection, and two inner tattoos used to measure voltage changes. (b) Photograph of 12 GETs, each with a surface area of 25 mm², placed on the radial (six tattoos, comprising Bio-Z1 and Bio-Z2) and ulnar (six tattoos, comprising Bio-Z3 and Bio-Z4) arteries on a participant’s wrist. This multiplexed tattoo placement is essential for effective BP capture. The arteries are pseudo-colored in pink for visibility, and their locations were tracked using an ultrasound vascular Doppler probe. (c) Close-up view of six GETs at the radial artery. The injecting GETs are pseudo-colored in green, the Bio-Z1 pair in violet, and the Bio-Z2 pair in blue, as the graphene is almost invisible. (d) Cross-section of the six GETs, with green lines representing the ac injected signal and gray lines representing voltage sensing. (e) Close-up view of one pair of sensing GETs and the simplified equivalent electrical circuit of the interface, showing Ztissue and Zartery, part of which (ΔZartery) is related to the undulating blood volume. (Credit: a, Jo Wozniak, Texas Advanced Computing Center)
"Taking infrequent blood-pressure measurements has many limitations, and it does not provide insight into exactly how our bodies are functioning," said Dr. Roozbeh Jafari, professor of biomedical engineering, computer science and electrical engineering at Texas A&M and the co-leader of the project.
How Does the Tattoo Work?
The device makes its measurements by injecting an ac current into the skin and then analyzing the body's response to determine bioimpedance (Fig. 2).

2. Schematic of the 13 GETs placement on the left-hand wrist required for effective BP estimation. The current injection tattoos are colored in magenta, sensing tattoos in light blue, and the reference electrode is colored in light orange.
There’s a correlation between bioimpedance and changes in blood pressure that has to do with blood volume changes. However, as with nearly all medical-sensed data, the correlation isn’t especially direct or clear, so the team had to create a machine-learning model to analyze the connection to get accurate blood-pressure readings, in addition to the custom circuitry (Figs. 3 and 4).

3. Block diagram of the Bio-Z signal-acquisition hardware: The transmit (TX) unit injects a gain and frequency-programmable ac current at 10 kHz. The receive (RX) unit elevates the Bio-Z signal through IA and filters through an anti-aliasing low-pass filter (LPF) with cutoff of 30 kHz. The filtered signal is sampled with the analog-to-digital converter (ADC) and through the FTDI USB bridge, then transferred to the PC for digital signal processing (DSP).
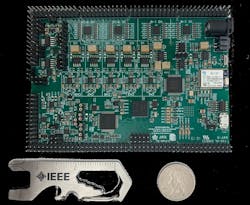
4. Photograph of the custom-developed PCB for multichannel Bio-Z sensing hardware: While the board is comparably small, it integrates discrete integrated components, operates 10 simultaneous channels, and covers a wide range of applications that require low-noise operation. Hence, when tuned toward a single application, the circuitry can easily be fit into much smaller (and even flexible) form-factor circuit board.
As their self-adhesive, low-impedance graphene electronic tattoos settle on the skin and sense from the same location over time, the BP estimation model for the tattoo placement is determined at the outset, without the need to recalibrate the model for each electrode placement. Also, the graphene-enabled impedance BP (Z-BP) doesn’t suffer from electrode misplacement or other sensing issues.
This in contrast to other wearable electrode types such as those based on optical, acoustic, or pressure techniques. Note that these alternatives are fully discussed and analyzed in their Supplementary Information posting.
Human Trials
The team used seven subjects for their tests (Fig. 5) and compiled extensive data (having a limited number of real subjects is one of the chronic problems when testing devices for medical applications as compared to, say, RF links; this is so even for non-invasive, non-risky tests).
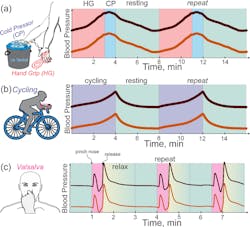
5. Schematic illustration on diastolic blood pressure (DBP - dark orange) and systolic blood pressure (SPB - maroon) dynamic changes during different exercise routines: In (a), the HGCP routine happens as follows: The subject performs handgrip (HG) exercise for three minutes, slowly raising their DBP and SBP, then placing their hand into an ice-cold water bucket (cold pressor, CP) for one minute to ensure that BP first goes even higher, then very slowly decreases over the four-minute resting period. Right side shows the according slow increase of both DBP and SBP with a smooth decline after CP phase. In cycling routine (b), the subject is stationed to perform a set of bike-cycling treadmill exercises for four minutes, with four minutes of break for resting in between. As can be seen from the illustrative time traces, the problem with cycling is a very rapid decrease in BP when the subject stops exercising, alongside a rather low rise in the DBP and SBP amplitudes during the exercise. In (c), the Valsalva routine is depicted, consisting of a subject pinching their nose while trying to breathe out intensely for 20-30 seconds, creating an extensive buildup of inner pressure, raising BR, then decreasing, and rapidly increasing it once again very rapidly. The Y-axis scale is considered equal in all images, illustrating that Valsalva and HGCP routines result in much higher change in BP amplitudes compared to the cycling routine. Since the Valsalva routine is very quick, it’s prone to estimation errors, as the Finapres BP recordings are very noisy. Smoothing down the original BP time-trace results in slight loss of the original BP trace.
Ultimately, accuracy of the approach is what counts. The team did extensive data analysis comparing their data to the standard, and they present the results with a plethora of graphs.
Of course, a single summary number also is nice. They claim an accuracy of 0.2 ± 4.5 mm Hg for diastolic pressures and 0.2 ± 5.8 mm Hg for systolic pressures, a performance equivalent to Grade A classification for blood pressure.
(For perspective, note that most biologic phenomena are low and slow: a blood pressure reading of 100 is fairly low pressure on the broader engineering scale at just 0.133 bar, 13332 Pascals, or ~2 psi – and you’re trying to sense those low levels with accuracy and consistency despite sensing and electrical noise.)
Their work is detailed in an eight-page paper “Continuous cuffless monitoring of arterial blood pressure via graphene bioimpedance tattoos” published in Nature Nanotechnology. The paper is behind a paywall, but that page does have open links to some interesting posted videos. The good news is that you can access the paper itself without the figures here, while the figures and their captions are available separately here (scroll down).
Finally, there’s a 51-page Supplementary information posting that has extensive and fascinating discussion of the technique, setup, comparative analysis with other approaches, extensive data, numerous photos, electronics details, signal processing, machine learning, data and error analysis (do you know what a “violin plot” of data is?), and much more.
About the Author

Bill Schweber
Contributing Editor
Bill Schweber is an electronics engineer who has written three textbooks on electronic communications systems, as well as hundreds of technical articles, opinion columns, and product features. In past roles, he worked as a technical website manager for multiple topic-specific sites for EE Times, as well as both the Executive Editor and Analog Editor at EDN.
At Analog Devices Inc., Bill was in marketing communications (public relations). As a result, he has been on both sides of the technical PR function, presenting company products, stories, and messages to the media and also as the recipient of these.
Prior to the MarCom role at Analog, Bill was associate editor of their respected technical journal and worked in their product marketing and applications engineering groups. Before those roles, he was at Instron Corp., doing hands-on analog- and power-circuit design and systems integration for materials-testing machine controls.
Bill has an MSEE (Univ. of Mass) and BSEE (Columbia Univ.), is a Registered Professional Engineer, and holds an Advanced Class amateur radio license. He has also planned, written, and presented online courses on a variety of engineering topics, including MOSFET basics, ADC selection, and driving LEDs.
Comment About the Article
To join the conversation, and become an exclusive member of Electronic Design, create an account today!

Leaders relevant to this article: