Working with High-Level-Language Debuggers in RISC-V-Based Apps

This article is part of the TechXchanges: Trace Debugging Techniques and Developing High-Quality Software
Members can download this article in PDF format.
What you'll learn:
- What are the RISC-V External Debug Support Version 0.13.2 specifications?
- Advantages of a using high-level-language debugger.
- The role of the ubiquitous breakpoints in debugging.
- How trace is indispensable in rooting out otherwise tough-to-find issues.
The quality of a product will only be as good as the debugging capabilities that a developer has available. Developers must be able to analyze and track the exact root of a specific bug or understand what’s happening on every line of code. Without such capabilities, developers might apply workarounds most of the time, using best guesses instead of fixing the real issues.
Depending on the maturity of the development organization, it’s estimated that developers can spend up to 80% of their time in debugging. If they could isolate defects before they make it into a release build, they would have a lower defect injection rate. Therefore, the organization’s quality metrics could be reached much more quickly, reducing the development efforts overall.
RISC-V Core and Debugging Capabilities
The RISC-V External Debug Support Version 0.13.21 specifies the debug interface for RISC-V based devices or systems-on-chip (SoCs). This article will not go into details on the interface specification that has been ratified in 2019.
The RISC-V External Debug interface in combination with a capable debug probe like I-jet or similar probes1 enables developers to examine the application’s behavior from various angles. Together with a toolchain, the debug architecture can make debugging quick, easy, and very precise.
On top, there are also ways to analyze an application even more in details through trace. The RISC-V International organization has been working to standardize trace specifications for RISC-V.
Two main task groups have been working on the specifications. The first task group is the Processor Trace working group3 that has a first ratified version of the standard describing the trace format, also known as E-Trace for RISC-V. The second is the RISC-V Nexus Trace group,4 which is working with recommendations on how to use trace as defined by the Nexus IEEE-ISTO 5001 standard for RISC-V cores.
Implementing trace IP in a device brings the possibility to non-intrusively trace the application as it’s running. In a detailed approach, trace is a continuously accumulated sequence of each instruction executed for a selected part of the application.
There’s no speed/code penalty when using trace, so the application will run smoothly during the process. However, the tradeoffs are that trace adds some cost to the final silicon, and probes tend to be more complex. Still, the benefits will easily outweigh that cost for embedded developers. Furthermore, high-end debugging probes also supporting trace are now available for a relatively lower cost.
General Features of a High-Level-Language Debugger for RISC-V
A high-level-language debugger for embedded applications is designed for use with C/C++ compilers and assemblers providing development and debugging within the same application. This opens up more possibilities such as during a debug session, one can make corrections directly in the same source-code window that’s used to control the debugging. It’s also possible to inspect and modify breakpoint definitions when the debugger isn’t running, and breakpoint definitions flow with the source code while editing.
The extensive debug information for the debugger generated by the build tools (ELF/DWARF output with debug symbols), combined with the RISC-V External Debug Support Version 0.13.2, results in good debugging possibilities (Fig. 1).
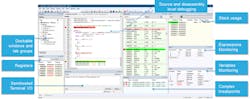
Taking a closer look, it’s possible to observe that a high-level-language debugger allows for switching between source and disassembly debugging as required, for both C or C++ and assembler source code.
In addition, compared to traditional debuggers, with which the finest granularity for source-level stepping is line by line, a high-level-language debugger provides a finer level of control by identifying every statement and function call as a step point. This means that each function call inside expressions, and function calls that are part of parameter lists to other functions, can be single-stepped. This is particularly useful when debugging C++ code, where numerous extra function calls are made, for example, to object constructors.
Furthermore, the high-level-language debugger breakpoint system allows for setting breakpoints of various kinds in the application being debugged, making it possible to stop at locations of particular interest. Examples include setting breakpoints to investigate whether the program logic is correct or investigating how and when the data changes.
Likewise, for variables and expressions, there’s a wide choice of features. It’s possible to monitor values of a specified set of variables and expressions, continuously or on demand. Or one can choose to monitor only local variables, static variables, etc.
Moreover, when an application is executed in a high-level-language debugger, it’s possible to view the elements of library data types such as STL lists and vectors. This provides a very good overview and debugging opportunities when working with C++ STL containers.
Again, the compiler generates extensive call stack information. This enables the debugger to show, without any runtime penalty, the complete stack of function calls wherever the program counter is situated. It’s allowed to select any function in the call stack, and each function can obtain valid information for local variables and available registers.
Finally, RTOS awareness offers a high level of control and visibility over an application built on top of an RTOS. It displays RTOS-specific items like task lists, queues, semaphores, mailboxes, and various RTOS system variables. Task-specific breakpoints and task-specific stepping make it easier to debug tasks.
Breakpoints and the Essence of Debugging
The fact is that developers can’t live without breakpoints. With a high-level-language debugger, various types of breakpoints can be set in the application to be debugged, which enables stopping at locations of particular interest. It’s possible to set a breakpoint at a code location to investigate whether the program logic is correct, or to get trace printouts.
Beyond code breakpoints, additional breakpoint types might be available. For example, it might be possible to set a data breakpoint to investigate how and when the data changes. It also lets the execution stop under certain conditions, which can be specified.
The breakpoint can trigger a side effect, too—for instance, executing a macro function by transparently stopping the execution and then resuming. The macro function can be defined to perform a wide variety of actions, such as simulating hardware behavior. All of these possibilities provide a flexible tool for investigating the status of the application.
Breakpoints Supported in a High-Level-Language Debugger
Different types of breakpoints can be used to investigate different types of issues, or even be combined for the best results. Let’s expand and exemplify the most common use cases.
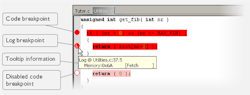
The code breakpoints are used for code locations to investigate whether the program logic is correct or to get trace printouts. Code breakpoints are triggered when an instruction is fetched from the specified location. If the breakpoint is set on a specific machine instruction, the breakpoint will be triggered, and the execution will stop before the instruction is executed.
Also, the log breakpoints provide a convenient way to add trace printouts without having to add any code to the application source code. Log breakpoints are triggered when an instruction is fetched from the specified location. If the breakpoint is set on a specific machine instruction, the breakpoint will be triggered, and the execution will temporarily stop and print the specified message in the debug log window.
Figure 2 shows the breakpoint usage in a RISC-V high-level-language debugger. Notice that all breakpoints can be disabled and kept in the original locations for later use.
The data breakpoints are primarily useful for variables that have a fixed address in memory. If a breakpoint is set on an accessible local variable, the breakpoint will be set on the corresponding memory location. The validity of this location is only guaranteed for small parts of the code.
Data breakpoints are triggered when data is accessed at the specified location. The execution will usually stop directly after the instruction that accessed the data has been executed.
Furthermore, data log breakpoints are triggered when a specified memory address is accessed. A log entry is written in the data log window for each access. Using a single instruction, the microcontroller can only access values that are four bytes or less.
A high-level-language debugger also supports immediate breakpoints, which will halt instruction execution only temporarily. Thus, a macro function can be called when the simulated processor is about to read data from a location or immediately after it has written data. Instruction execution will resume after the action. This type of breakpoint is useful for simulating memory-mapped devices of various kinds (for instance serial ports and timers).
Finally, it’s worth mentioning that the trace start trigger and trace stop trigger breakpoints, which start and stop trace data collection, is a convenient way to analyze instructions between two execution points. Trace breakpoints are only available for probes and devices supporting a RISC-V trace implementation.
Monitoring Stack-Memory Usage
The handling of the stack is one of the major challenges for embedded software developers. A proper configuration of the stack is essential to the system stability and reliability. If the stack size is too small, an overflow situation could occur. On the other hand, setting the stack size too large means a waste of RAM resource, which could be limited in some RISC-V-based embedded systems.
A professional development tool should make it possible to estimate stack usage via the compiler and linker, and control and monitor it via the debugger.
Figure 3 shows an example of monitoring a stack. When the application is first loaded, and upon each reset, the memory for the stack area is filled with the dedicated byte value, e.g., 0xCD before the application starts executing. Whenever execution stops, the stack memory is searched from the end of the stack until a byte whose value isn’t 0xCD is found, which is assumed to be how far the stack has been used.
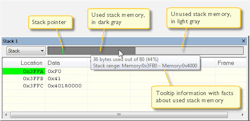
The light gray area of the stack bar represents the unused stack memory area, whereas the dark gray area of the bar represents the used stack memory. For this example, only 44% of the reserved memory address range was used, which means that it’s worth considering decreasing the size of memory.
Although this is a reasonably reliable way to track stack usage, there’s no guarantee that a stack overflow is detected. For example, a stack can incorrectly grow outside its bounds and even modify memory outside the stack area—without actually modifying any of the bytes near the end of the stack range. Likewise, the application might modify memory within the stack area by mistake.
How Can Trace Make the Difference?
Trace is known to help make a quick diagnosis of common problems that are nearly impossible to find without it. By using trace, it’s possible to inspect the program flow up to a specific state, for instance an application crash, and use the trace data to locate the origin of the problem. Trace data can be useful for locating programming errors that have irregular symptoms and occur sporadically.
Using trace requires that the target system can generate trace data. Once generated, the high-level-language debugger can collect it via the trace probe,1 and developers can visualize and analyze the data in various windows and dialog boxes.
Figure 4 depicts how trace-related windows are utilized, including trace instructions, function trace, and a graphical timeline with all function calls and timing information.
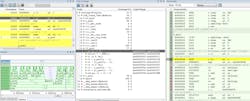
When trace data is collected, it’s possible to perform searches in the collected data to locate the parts of the code or data that might be interesting, such as a specific interrupt or accesses of a specific variable. And code coverage functionality available with trace is useful when test procedure is designed to verify whether all parts of the code have been executed.
It also helps to identify parts of the code that aren’t reachable. This is highly valuable and made mandatory by the safety standards when working with critical safety applications.
Trace functionality is extremely valuable and explored in detail in the article Trace Techniques for RISC-V – How to Use it Efficiently.”4 It could help find those “million-dollar” bugs in your application.
Get Help from the Right Debugging Tools
Only those who have ever experienced a hard fault in an RISC-V-based design know how difficult and frustrating it can be to track down the ultimate issue. It’s not uncommon to spend several days trying to isolate the issue and come up with a fix or end up with a poor workaround. Some bugs might be difficult to catch and only pop up randomly and in elaborated circumstances.
A high-level-language debugger with useful functionality like complex and conditional breakpoints, data and log breakpoints, macros, stack monitoring and trace on top are shortcuts that can boost the efficiency while gaining complete control of every line of code and every single instruction executed in the complex application.
By using the right debugging tools (that all developers deserve) the right way, it’s possible to reasonably shorten the development cycle by fixing bugs for real.
Read more articles in the TechXchanges: Trace Debugging Techniques and Developing High-Quality Software
References
1. https://riscv.org/exchange/software/
2. https://riscv.org/wp-content/uploads/2019/03/riscv-debug-release.pdf
3. https://lists.riscv.org/g/tech-trace
About the Author
Rafael Taubinger
Technical Marketing Specialist, IAR Systems
Rafael Taubinger is the Technical Marketing Specialist at IAR Systems, based at the headquarters in Sweden. Prior to his current role, he served as Global FAE Manager and Senior FAE at IAR Systems. He has over 15 years of experience in the embedded industry and holds a B.S. degree in Electrical Engineering with emphasis in Electronics and a Master of Business Administration (M.B.A) degree in Business Management.
Rafael is highly skilled in C/C++ programming languages for 8-, 16- and 32-bit microcontrollers, and has 2000+ hours of technical training in the U.S., Latin America, and Europe about embedded applications, C/C++ programming, safety coding, system reliability, efficiency, modeling, code analysis, and best development practices.
Comment About the Article
To join the conversation, and become an exclusive member of Electronic Design, create an account today!

Leaders relevant to this article: