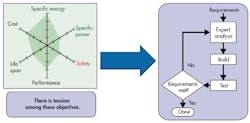
The demand for safety and high performance in Li-ion batteries has never been so high. Cells and pack manufacturers are looking for high energy density (or specific energy), high power density (or specific power), safety, long life span and low cost (Fig. 1.)
Achieving these goals with significant improvement is very challenging. Increasing the energy, power, energy density, or power density of a cell is not a trivial problem. It involves a lot of parameters. The same problem is applied to building a battery pack and controlling its temperature behavior under various conditions and duty cycle to ensure safety, life, and performance.
Large cell and pack producers know this challenge very well. It costs money and time to test and validate all the different material combinations. Speeding up the design process and reducing the cost is an objective battery manufacturers are obsessed with.
Computer-aided engineering (CAE) is part of the solution. It has the ability to allow testing multiple designs at very low cost in a fraction of the time usually necessary for experimental work. Battery Design Studio (BDS), a powerful cell design software and cell testing platform, can address this. For pack designs, STAR-CCM+ Battery Simulation Module (BSM) has the ability to simulate 3D representation of packs in electrothermal simulations to predict with high accuracy the complex behavior of this critical component of an xEV powertrain.
In this way, hundreds of designs can be tested at low cost. However, building each cell/module virtually still takes time and relies on continuous analysis to improve the design. This could be improved by coupling BDS and BSM to an optimizing software, such as HEEDS, to let this latter one take control on preparing the digital cells/modules and running the analysis.
HEEDS (Hierarchical Evolutionary Engineering Design System) MDO is a software package that interfaces with commercial CAE tools in order to automate and improve the search for better product and/or process designs. HEEDS can perform both single-objective and multi-objective (Pareto) optimization. Additionally, HEEDS includes the ability to perform Design of Experiments and Reliability analysis. HEEDS MDO was formerly named HEEDS Professional.
Products such as Nitinol stents, crash rails in automobiles, MEMS, and fiber composite parts have all been designed using HEEDS, a tool that generically interfaces with analysis codes through batch execution and different forms of scripting. HEEDS also includes direct interfaces to popular CAE tools such as Abaqus, ANSYS, LS-DYNA, Nastran, NX, STAR-CCM+, and Microsoft Excel.
In the following parts, it will first be demonstrated how a well-developed commercially available cell can still be improved thanks to a unique coupling between BDS and HEEDS. In the second part, the design of a battery module for xEV application will be studied.
Cell Description
The commercial cell to be used in this study is a cylindrical cell of type 36650, which means 3.6 cm in diameter and 6.50 cm in height. It is a high-power cell and the chemistry used for the cathode is a blend of Nickel Cobalt Manganese (80%) and Lithium Manganese Oxide (20%) (NCM and LMO). The anode is made of graphite.
Because it is a high-power cell, it is able to operate at very high current while still retaining most of its available energy. Typically, the power capability and the available energy are referred to power density and energy density, which is the available power/energy per unit mass expressed in W/kg and Wh/kg respectively. Battery cells are such systems that they cannot provide high power density with high energy density, one of the trade-off in cell design. However, it is still possible to optimize the amount of energy such a high power cell can contain. This is what we suggest to achieve in this example.
Before starting the optimization, it is firstly important to accurately characterize the reference cell in BDS. It requires therefore, to specify the geometrical dimensions of each parts, such as electrodes, coating, tabs, etc., as well as the physics based performance model to predict the cell behavior. Tab designs, electrode dimensions, and coating formulations can be easily input in BDS-friendly user interface.
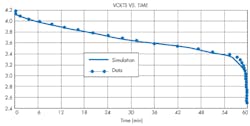
The elaborated physics-based model is also defined and calibrated. The many controls enable accurate cell performance prediction as it can be seen in Fig. 2, comparing experimental and simulation voltage results on a 1C discharge procedure.
Parametrization 1
With this reference cell built, the optimization work can start. Since the objective is to maximize the energy density (Wh/kg), the changes will be focused toward weight reduction and increase in the coating length (in order to add more active material in the cell and therefore more energy).
It was decided to select the following design variables for the study:
- Positive electrode: Length, number of tabs, and current collector thickness
- Negative electrode: Length, number of tabs, and current collector thickness
- Positive tabs: Width
- Negative tabs: Width
Each of these design variables evolve within relevant ranges so they make physical sense but also they make manufacturing sense. The design exploration study will perform 100 designs.
Results
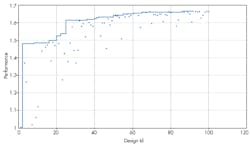
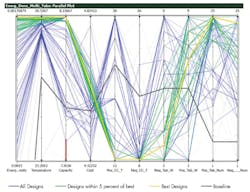
The results observations show a significant ~60% energy density increase compared to the reference case (Fig. 3). HEEDS has useful outputs to easily visualize the different parameters changes and highlight combination trends which give best results. This can be seen on a “Parallel Plot” as in Fig. 4.
Highlighted in green are the best combinations – they show indeed the highest energy density. One can notice that the best results are achieved with low current collector thickness (Neg_CC_T, Pos_CC_T) and high tabs count (Pos_Tab_Num, Neg_Tab_Num).
The yellow curve shows the combination for the best design. It can be seen, that energy density is much higher than on the reference design highlighted on the plot in grey.
However, one point noticed is that the best design has a higher material cost than the reference design. It would be ideal to have the best of both worlds, which is increasing the energy while reducing the cell material price at the same time. This is what we are going to look at now.
Parametrization 2
In this second study, in addition to the previous study inputs, we are now also including the material cost, something which can be handled by BDS. The design exploration study becomes a multi-objective study in which energy density will be maximized while cost will be minimized.
The result will not be one single best design but a set of best designs, a trade-off of optimum designs between energy density and cost known as the Pareto front.
Results
From this Pareto front were selected two (out of nine) designs that match both requirements in terms of energy density and cost as seen in Table 1.
Designs 85 and 119 both show good improvements. As expected, one can have significant energy density improvement with lower cost reduction or vice versa. Design 85 is closest to the best design in the previous study in terms of energy density but shows a $0.09 material cost reduction. It may appear as a small improvement, but when multiplied by 100 of thousands or millions of cells produced, this has an impact. Alternatively, if one is looking at higher cost reduction, design 119 is a good choice with $0.17 cost reduction, but still offering a 31% energy density increase.
Conclusion
Improvements into modeling of Li-ion cell behavior have made associated CAE software a powerful tool to design and size cells and packs. It allows for a tight coupling between the electrochemical and thermal problem which provides great accuracy in predicting these complex systems.
Design exploration enables optimized cell performance and includes physical and cost performance objectives analysis.
The ability to automate the simulation set-up and computations brings a significant gain in productivity, the cell design exploration study was computed in a day.


