Making Ripple Measurements
Making ripple measurements has traditionally been using an oscilloscope. For a number of technical reasons, an oscilloscope, in general, is not necessarily the best choice for measuring ripple. These include relatively poor sensitivity, poor signal-to-noise performance (SNR), low resolution (generally 8 bits), and insufficient bandwidth. Bandwidth is generally reduced for low amplitude AC coupled signals.
There are several common issues. The first issue occurs when we try to measure ripple with a 1X AC coupled scope probe. A typical 1X scope probe only provides a bandwidth of 8-10MHz, while an uncompensated probe can show peaking at higher frequencies. Second, many scopes reduce the available bandwidth when used at the most sensitive settings or when AC coupled is enabled. Scopes often have a higher noise floor when set to high input impedance mode. Fig. 1 shows the typical frequency response of a 1X/10X scope probe in both the 1X and 10X positions.
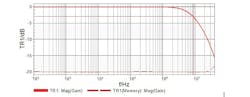
1. VNA measurement using an inexpensive 60MHz 1X/10X scope probe. A 1X scope probe has very limited bandwidth (8.6MHz, in this case) while the 10X probe has a much flatter frequency response, but at the cost of a 20dB sensitivity reduction.
A 50 Ω coaxial cable, on the other hand, terminated into 50 Ω, offers a very flat response and, with unity gain, maximizes sensitivity of a passive connection. If the circuit being tested can tolerate the low AC impedance presented by the coax cable and the 50 Ω termination, this is a better solution than the 1X or 10X probe.
Couple Coaxial Cable
In order to make the best use of the scope’s sensitivity and bandwidth it is necessary to AC couple the coax cable to the 50 Ω scope input using something for DC voltage blocking other than the scope’s AC coupled mode. Here, we use the Picotest J2130A DC Bias injector. Keeping the scope in DC mode with a 50 Ω termination lets us obtain the maximum measurement bandwidth.
Fig. 2 is a sample measurement of a point of load regulator, Texas Instrument’s LMR10515Y 5.5V, 1.5A Simple Switcher that is part of the Picotest VRTS2 demo board.
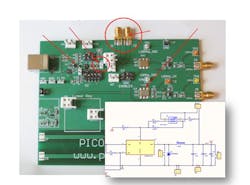
2. Physical and electrical diagram for a 2.8MHz Point of Load (POL) regulator whose ripple was measured. The POL provides power for a 10MHz clock whose position is noted.
Fig. 3 shows the measurement setup for the ripple measurement using the LeCroy 10X scope probe connected to a Picotest J2180A preamplifier (adds 20dB of gain). The VRTS2 demo board is part of a power supply measurement learning kit that was created to help engineers come up to speed on using a VNA to perform all types of power supply measurements. The output of the POL is coupled to the scope using a preamplifier and a bias injector to remove any DC component from the signal. This allows setting the scope to its highest sensitivity without over-ranging.
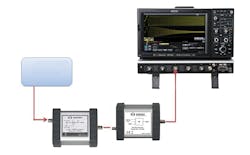
3. Connection diagram for the ripple measurement. The preamplifier is attached to the scope using a DC bias injector, used for blocking DC voltage. This ensures you don’t overrange the ADC at 1mV/div due to DC in the preamplifier output.
Some high frequency is evident in the left side of Fig. 4 as a result of the inductance of the ground clip resonating with the capacitance of the probe. On the right side of Fig. 4, a 50 Ω coaxial cable with very short leads is connected to the header close to the POL output capacitors. The coax is AC coupled to the scope using the bias injector and the scope is set to DC 50 Ω input and full bandwidth. The measurement is much cleaner, though the amplitude and general wave shape are approximately the same. The resonant ringing is eliminated due to the very short leads.
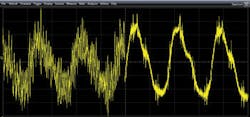
4. POL output ripple voltage at the header close to the output capacitors with full bandwidth. The left side is made with a Lecroy 500MHz 10X scope probe with ground clip and preampifler as shown in Fig. 3. On the right side a coax cable with the DC bias injector and 50 ohm termination results in a higher fidelity measurement.
Spectral Content
While we have successfully measured the ripple and noise using two configurations, the time domain results still offer little information about the spectral content. The spectral content is often more important than the peak-to-peak result, since the spectral content provides insight into the source of the ripple and noise, as well as information about how to filter out the noise if the signal levels are too high.
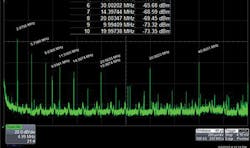
We can conveniently perform frequency domain measurements using the spectrum analyzer built into the Lecroy 640zi. This measurement uses the same test setup used for the right side of Fig. 4. The spectrum analyzer is set to measure from 100kHz to 50MHz, though the instrument capability is much wider, both lower and higher in frequency. The results of this measurement, shown in Fig. 5 (see below), provide insight into the sources of the noise. We can clearly see the switching frequency (and the harmonics) from the 2.8MHz point-of-load regulator. We can also see signals related to a 10MHz clock which is also on this demo board and powered by the point-of-load (POL). We can now see that there are two sources of noise and the levels of each harmonic of each of the sources.
Converting the 2.8MHz spectrum measurement (-37.81dBm) to a peak-to-peak amplitude we have:

=

The majority of the 14mVpp signal is due to this fundamental frequency, which is also evident in the nearly sinusoidal shape seen in Fig. 4.
The ripple and noise from the regulator is not uniform across the printed circuit board (PCB). It varies with location due to the finite impedances of the printed circuit board traces and the proximity to the decoupling capacitors.
In the top image of Fig. 6 (see below), the measurement is repeated using the 1X 60MHz scope probe to show how significantly the measurement is degraded. In the bottom image of Fig. 6, the measurement is made at one of the PDN SMA connectors as shown in Fig. 2. This location is further from the point-of-load output capacitors and closer to the clock, which does not have a local decoupling capacitor. The decoupling capacitor is purposely left out in order to display this point more clearly. Note that in this measurement the point-of-load signal is much smaller than the clock signal.
Spectral Measurements
The FFT spectrum measurements in Fig. 5 and Fig. 6 provide much more detailed information on frequency and harmonics that can be used to determine the source of the noise and improve the decoupling performance to better filter the ripple.
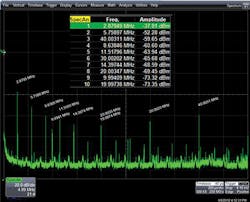
5. FFT spectrum capabilities of the oscilloscope offer important information about the ripple in the form of spectral content. In this measurement made at the header close to the output capacitors we can see the 2.8MHz switching frequency and its harmonics, as well as the harmonics of the 10MHz clock it is powering. We cannot see the clock fundamental, because the output capacitors present a low impedance at this frequency. The 10MHz is evident, but not marked as the amplitude is lower than the other harmonics.
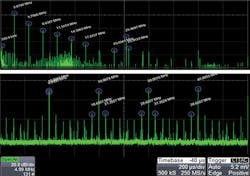
6. Spectral result with a 1X scope probe at the header (top image). Note how significantly the measurement is degraded compared with Fig. 5. In the lower image, ripple is measured at one of the PDN SMA connectors further from the POL output capacitors. Amplitudes of POL frequencies are reduced while clock frequencies are increased.
We have shown that the traditional method of using an oscilloscope to make ripple measurements does not always produce the high fidelity and bandwidth we expect or need. In most cases, engineers need to make both time domain and spectrum domain measurements. We have also shown how to use the time domain and spectrum domain information to determine the sources of the ripple. This ripple is not always due to the switching regulator, but sometimes is due to what the power supply is driving.

About the Author
Steve Sandler
Steve Sandler is the founder and chief engineer of AEi Systems LLC and the president of Picotest. At Picotest he is responsible for signal injector product development, as well as the overall operation of the test equipment company.
Comment About the Article
To join the conversation, and become an exclusive member of Electronic Design, create an account today!

Leaders relevant to this article: