IBM Research Solar Camera Watches for and Predicts Solar Energy
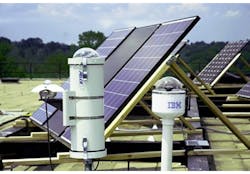
The best solar panel only converts about 20% of the sun’s rays hitting its surface into usable electricity. On a perfect day at sea level, that panel could generate approximately 200 watts of electricity per square meter. Introduce clouds, shade from trees, or dust in the wind and that power drops even further—making solar a variable energy source for the grid, or anything else powered by photovoltaic panels. So, our physical analytics team at IBM Research built a basketball-sized and -shaped camera that can predict solar radiation for the Department of Energy—and more recently, the University of Michigan’s solar car team (Fig. 1).
The wide-angle (more than 180 degrees) sky camera provides information on sky conditions and their rate of change. Where is the sun? How many clouds are in the sky (and with some triangulation with other cameras, how high are they)?
The sky camera is also built with a solar pyranometer, GPS sensor, and onboard processor, all packaged in a weatherproof enclosure for external use. The pyranometer provides an instantaneous and precise readout of solar radiation. The GPS sensor gives precise location information. All of this information is processed using an onboard computer and a predictive model to generate real-time solar insolation (sun exposure) values and prediction for 10-15 minutes in the future. These results are transmitted by direct network connection, or satellite link in the case of the mobile unit.
The sky-camera data is sent to a cognitive computer that couples this real-time information with incoming weather data, such as wind speed and direction, as well as historical forecasts. The machine-learning algorithms that interpret this information give us an improved picture of how much solar energy our panels are absorbing now, and how soon-to-happen weather events will affect the panels’ ability to absorb the sun’s rays.
Knowing how much solar energy we will or won’t have in the next several minutes gives a grid operator time to shift energy resources. For example, our recent Department of Energy-funded tests with “ISO-New England, the grid operator serving Connecticut, Maine, Massachusetts, New Hampshire, Rhode Island, and Vermont, show that our system can be 30% more accurate than other state-of-the-art approaches.”
UM Solar Car
Utility grids are stationary. Put the camera in a place with an unobstructed view of the sky, and let the data roll in. So, when the University of Michigan’s solar car team asked us about using the cameras to help with forecasts for its World Solar Challenge race in Australia, we had to not only think about all the variables of it continuously seeing and understanding a new slice of sky as it cruised down the road, but also how we were going to make it mobile at all.
The solar car is a four-wheeled solar panel that can maintain speeds well above 60 miles per hour. And we would need to know at any moment the car’s solar absorption per square meter of its panel. A rental car’s roof luggage rack is not a good fit!
Thankfully, after a 600-mile mock race with the UM students, the mounting system was stable and ready for the Australian Outback.
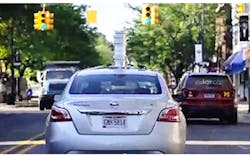
Our camera was perched on top of UM’s weather car (Fig. 2), which drives about 10 to 15 minutes ahead of their solar car. This allows the camera to absorb data from the approaching sky, and our system to produce a short-term forecast, for the UM team. If clouds are moving toward the route, they can determine if the solar car should change its speed based on the clouds’ speed —saving valuable time and energy.
The system will also use the camera’s data and historical forecast data to produce a long-range forecast. This prediction gives UM a benchmark to help decide where to park the solar car during the week-long race. Where and when the team stops will make an important difference in how efficiently they can recharge the car’s battery via the solar panels before nightfall.
Only three hours separated first and second place at the 2013 World Solar Challenge.
We hope our camera and system help UM save as many precious minutes as possible. We also hope that this race will demonstrate cognitive computing in solar forecasting. Large solar facilities, like ISO-New England, can quickly shift Gigawatts of power to other sources when a thunderstorm.
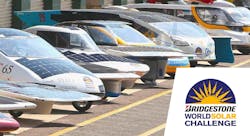
World Solar Challenge
The goal of the October 2015 World Solar Challenge was to stimulate research into, and development of, sustainable transport, which meant that this race was primarily a solar-powered car-design competition. The regulatory philosophy was to provide the parameters upon which to base the design, rather than specify exactly how each is to be achieved. Science and technology evolve, and to encourage the most innovative ideas, so, too, do the event requirements. The race, which happens every two years, was held October 18-25 in Darwin, Australia.
Participation in the 2015 World Solar Challenge called for the design and construction of a Solar Electric Vehicle within the given design parameters, and driving the Solar EV across the continent of Australia in accordance with these regulations. A record 47 teams from 25 different countries participated in the race.
The traditional route of the World Solar Challenge is from Darwin city center to Adelaide City center. There is only one road across the center of Australia, the Stuart Highway, which runs for 2,700 km from Darwin to Port Augusta. The final 300 km completes the journey from Port Augusta down to Adelaide on Highway One. The race took four days to complete.
Efficient balancing of power resources and power consumption is the key to success during the race. At any moment in time, the optimal driving speed depends on the weather forecast and the remaining capacity of the batteries. The team members in the escort cars continuously remotely retrieve data from the solar car about its condition and use these data as input for prior developed computer programs to work out the best driving strategy.
It is equally important to charge the batteries as much as possible in periods of daylight when the car is not racing. To capture as much solar energy as possible, the solar panels are generally directed such that these are perpendicular to the incident sun rays. Sometimes the whole solar array is tilted for this purpose.
The timed portion of the race stops at the outskirts of Adelaide, 2,998 km from Darwin. However, for the timings recorded at that point to count, competitors must reach the official finish line in the center of the city under solar power alone. The race is over public roads, so the cars must adhere to the normal traffic regulations; however, there is a special note in the official regulations remarking on the tendency of drivers to take advantage of a favorable road camber in order to capture the maximum amount of solar energy. After midday when the sun is in the west, it would be advantageous to drive on the right side of the highway, provided, of course, there is no traffic in opposite direction.
Driving time is between 8 a.m. and 5 p.m. In order to select a suitable place for the overnight stop (alongside the highway), it is possible to extend the driving period for a maximum of 10 minutes, which extra driving time will be compensated by a starting time delay the next day.
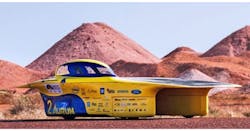
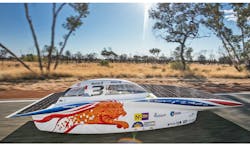
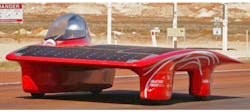
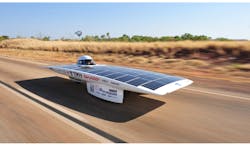
Figures 4, 5, and 6 show the first three cars to finish the race.
Comment About the Article
To join the conversation, and become an exclusive member of Electronic Design, create an account today!

Leaders relevant to this article: