Third Dimension Uncovers Signal Anomalies

The quality of an oscilloscope's display can make a big difference in your ability to troubleshoot your designs effectively.
Engineers traditionally think of digital storage oscilloscopes (DSOs) as two-dimensional instruments that graphically display only voltage vs. time. But there actually is a third dimension to a scope: the Z-axis. This third dimension shows continuous waveform intensity gradation as a function of the frequency of occurrence of signals at particular X-Y locations.
In analog oscilloscope technology, intensity modulation is a natural phenomenon of the scope's vector-type display, which is swept with an electron beam. Due to early limitations of digital display technology, this third dimension• intensity modulation was missing when digital oscilloscopes began replacing their analog counterparts. Now, it is making a comeback.
Display intensity gradation can be extremely important when you are looking for signal anomalies, especially when viewing complex, modulated analog signals such as video, read-write disk head signals, and digitally controlled motor drive signals. Intensity gradation also is helpful in a variety of mixed-signal applications found in embedded microprocessor and microcontroller technologies common in automotive, industrial, and consumer electronics applications. But even when you are viewing purely digital waveforms, intensity gradation can show statistical information about edge jitter, vertical noise, and the relative occurrence of anomalies.
Recently, all major digital oscilloscope vendors have begun to provide Z-axis intensity gradation to emulate the display quality of an analog oscilloscope.
Complex, Modulated Analog Signal Applications
If you are working with complex, modulated signals, you need a scope with sufficient display quality to let you look at the big picture and then zoom in to see the details.
Composite Video Signals
Many engineers are familiar with standard NTSC or PAL composite video signals, which are complex, modulated analog signals. Figure 1a shows one frame of composite video photographically captured from an analog oscilloscope's display. Even though the display flickers when you view this waveform at 5 ms/div, there is important information embedded within the displayed waveform envelope. An experienced video design engineer can quickly determine the quality of analog signal generation from this display.
Figure 1b shows an older digital oscilloscope display without Z-axis intensity modulation. Although this scope has sufficient sample rate and memory depth to capture details of this signal even at 5 ms/div, all captured points are displayed with the same display intensity. Waveform detail within the signal's en-velope is visually lost. Given a choice between analog oscilloscope technology and old digital display technology, it's no surprise that today's video labs are filled with analog oscilloscopes.
However, the visual quality of an analog oscilloscope's display finally has been matched in a digital oscilloscope. Figure 1c shows the real-time capture of a video signal using the latest-generation mixed-signal oscilloscope with a high-resolution display technology. This scope provides up to 256 levels of color intensity gradation for each pixel based on acquisitions as long as 8 MB mapped to a high-resolution display (XGA).
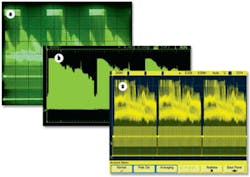
a. Display on a 100-MHz Analog Oscilloscope
b. Display on an Older Digital Oscilloscope
Without Intensity Gradation Capability
c. Display on a Mixed-Signal Oscilloscope
(click here to see larger image)
This digital oscilloscope can display a repetitive analog signal with quality similar to, or perhaps better than, an analog oscilloscope. It also can capture, display, and store complex single-shot signals with the same visual resolution. This is where conventional analog oscilloscopes fall short of their digital counterparts. Analog scopes can only display repetitive waveforms.
Figure 2 shows a zoomed-in display of a single line of the composite video captured from the same acquisition that is shown in Figure 1c. But since analog oscilloscopes can t digitally store waveforms, we are unable to show a similar zoomed-in, single-shot display using an analog oscilloscope.
Typical portable digital scopes on the market today with limited acquisition memory depths could not display the level of waveform details shown in Figure 2 after storing and zooming in on this particular signal. For example, scopes with just 10k of acquisition memory would display just 20 widely spaced dots after zooming in.
Digitally Controlled Motor Drive Signal
Another example of a complex analog signal is a digitally controlled motor drive signal. A one-time, start-up cycle of a motor would be classified as a single-shot phenomenon. An oscilloscope with high-resolution display technology can reliably capture one phase of this motor drive signal. You also can use this mixed-signal oscillo-scope's digital channels to synchronize and trigger the waveform capture based on the digital control signals of the motor.
This capability can be extremely important when you attempt to synchronize acquisitions on not only power-up sequences, but also on particular motor positioning commands. This oscilloscope could just as easily capture all three phases of the motor drive signals simultaneously using its four channels of analog acquisition.
Zooming in by a factor of 100 shows a bright vertical vector near the center of the display. Further waveform expansion of 20,000:1 on the pulse-width modulated (PWM) burst reveals a glitch. Other portable DSOs with shallow memory depths cannot use such a high expansion factor and at the same time retain good waveform detail.
Likewise, traditional analog oscilloscope technology would be unable to adequately capture and display these waveforms. With an analog oscilloscope set up to capture a single-shot sweep at 100ms/div, you would observe a vertical band of light streaking across the scope's display for 1 second.
Digital Signal Applications
The visual effects of a digital oscilloscope's intensity gradation capability are most dramatic when you view complex, modulated analog signals such as the composite video and motor drive signals. However, intensity gradation also is extremely important for uncovering signal anomalies when you are debugging digital circuitry.
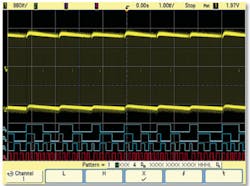
Figure 3 shows an example of uncovering a runt pulse embedded within a PWM. The bright spot near the center of each burst is an indication that our scope has captured a signal anomaly. By zooming in on one of the bright spots, we see details of the signal anomaly, as shown in Figure 4. Although an analog oscilloscope also will show the bright spots with repetitive sweeps, it is incapable of zooming in on stored waveforms.
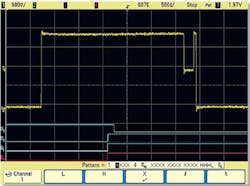
A typical portable DSO also would be incapable of showing either the bright spot at 1ms/div due to insufficient display quality or details of the runt pulse at 500 ns/div due to insufficient memory depth. After zooming in by a factor of 2,000 (1 ms/div to 500 ns/div), a scope with just 10k of acquisition memory would display only five digitized points (10k/2,000).
Display intensity gradation also is very important when you view waveforms that contain jitter, noise, and infrequent events. Levels of display intensity can help you interpret the relative frequency of occurrence of signal anomalies. Sometimes it can help you visually determine the type of jitter or noise in your system, based on display intensity dispersion, without resorting to sophisticated waveform analysis software.
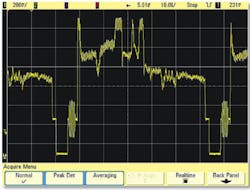
Figure 5 shows an example of a digital signal that includes timing jitter (near the left side of screen), vertical noise (top and bottom of waveform), and a very infrequent glitch (near the center of screen). Because of the relative dimness of the displayed glitch, we know that this particular glitch occurs very infrequently.
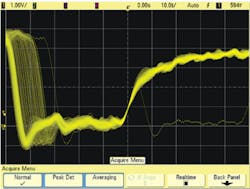
We also can see that the nature of the jitter is very complex and probably includes a large component of deterministic jitter (DJ). If the dispersion of display intensity on the signal's edge appeared to be Gaussian in distribution, we would suspect that the jitter might be dominated by random jitter (RJ).
Besides display quality, another very important characteristic that enables an oscilloscope to capture and show events such as this infrequent metastable state is the waveform update rate. This particular glitch occurred approximately one time every 50,000 cycles of the data signal. With a real-time waveform update rate of 100,000 waveforms per second, this oscilloscope can capture the glitch approximately two times per second when triggering on a rising edge of the signal.
A typical digital oscilloscope in this class with a maximum update rate of 3,500 waveforms per second would require continuous acquisitions for more than 14 seconds on average to capture just one glitch. With a typical debugging method of moving your probe from test point to test point every few seconds, you probably would miss this anomaly using a scope with relatively slow update rates.
Objectively Evaluating Display Quality
The quality of an oscilloscope's display is primarily a subjective issue. The best way to compare display quality between various digital oscilloscopes is to use them side-by-side and make visual comparisons using a variety of signals.
Unfortunately, evaluating digital scopes from different vendors side-by-side is not always possible. Although there does not exist today a single oscilloscope specification that quantifies a scope's display quality, there are three characteristics that contribute to quality of display that should be considered when evaluating the performance of an oscilloscope: display resolution, number of intensity-graded levels for each pixel, and acquisition memory depth.
Display resolution usually is specified as the type of display such as an XGA display (768 • 1,024) or a VGA display (640 • 480). Display resolution provides you with a relative indication of the number of pixels used for waveform display.
Although you might intuitively deduce that scopes with an XGA display have a display resolution of 786,000 pixels, not all pixels actually are used for waveform display. Some of the pixels are reserved for out-of-graticule menu graphics. Plus with 8-b of ADC vertical resolution, only 256 vertical pixels out of the possible 768 are used for real-time, nonaveraged waveform display.
Besides maximum X-Y display resolution of the oscilloscope, another important factor is the number of intensity levels for each pixel. Without Z-axis intensity modulation, complex waveforms will be displayed at a fixed display intensity, similar to the screen image shown in Figure 1b, regardless of the scope's specified display X-Y resolution.
The last factor to consider is acquisition memory depth. Agilent's 6000 Series Scopes map up to 8,000,000 points to the display after each real-time acquisition. This amount of acquisition memory exceeds the maximum number of pixels available for waveform display.
As a result, many of the pixels will receive multiple hits during each acquisition cycle. The number of hits determines the level of intensity for each pixel. For example, if a particular pixel gets hit just one time, it receives the minimum viewable level of intensity. Pixels that get 256 or more hits receive the maximum level of intensity.
Summary
When considering the purchase of your next digital oscilloscope, don't consider just bandwidth, sample rate, number of channels, and memory depth. Another very important criterion is display quality. An oscilloscope's third dimension, the Z-axis, which shows intensity gradation of signals based on frequency of occurrence, can reveal important waveform details, including signal anomalies, in a wide variety of both analog and digital signal applications.
About the Author
Johnnie Hancock is a signal integrity applications engineer with the Electronic Products Group at Agilent Technologies. He began his career with Hewlett-Packard in 1979 as an embedded hardware designer and holds a patent for digital oscilloscope amplifier calibration. Mr. Hancock graduated from the University of South Florida with a degree in electrical engineering. Agilent Technologies, 395 Page Mill Rd., Palo Alto, CA 94303, 800-829-4444, e-mail: [email protected]
FOR MORE INFORMATION
on oscilloscope display quality
www.rsleads.com/507ee-189
About the Author
Comment About the Article
To join the conversation, and become an exclusive member of Electronic Design, create an account today!

Leaders relevant to this article: