Measuring SNR, SINAD, and THD Quickly

Testing high-resolution data converters with commercially available test equipment always has presented a significant challenge. Until recently, manufacturers of such converters had to extend their test equipment capabilities by racking bench instruments or designing complicated circuitry on their load boards, severely complicating component test and compromising correlation between setups.
The parameters that define the audio quality of a single-tone sine wave are signal-to-noise ratio (SNR), total harmonic distortion (THD), and signal-to-noise and distortion ratio (SINAD), also known as total harmonic distortion plus noise (THD+N). These parameters are measured on a signal that includes a single tone plus additional unwanted frequency components. These components are either harmonics of the signal or noise and other spurs. This can be represented mathematically by the relationship
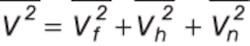
The critical audio signal parameters then are evaluated from the equations
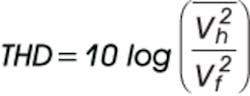
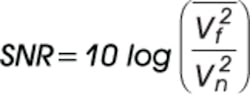
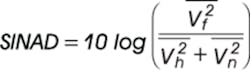
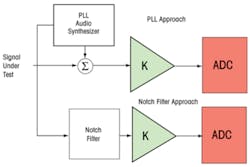
Figure 1. Techniques to Extend the Measurement Dynamic Range
Measuring SNR, SINAD, and THD Quickly
Standard instruments currently used to measure SNR, SINAD, and THD include spectrum analyzers and digitizers but both have noise issues that generally preclude measuring SNR and SINAD beyond 100 dB and THD better than -110 dB. Special techniques such as notch filters and nulling approaches are needed for measuring tighter specifications. In both of these methods, most of the fundamental is eliminated and only a residual signal is measured. A block diagram of these techniques is shown in Figure 1.
The PLL-based nulling approach requires a very pure synthesized sine wave without excessive noise or harmonic distortion, which implies a significant amount of time for settling to a stable amplitude, frequency, and phase. The technique eliminates the problem of digitizer accuracy because the effects of digitizer inaccuracies are attenuated by the amplifier with a gain of K.
The notch filter technique removes the need for a highly stable synthesizer, but it introduces other potential problems. The notch must be made programmable, or only a few fixed frequencies can be tested. The notch will attenuate the noise in the region of the notch and mask problems relating to skirting—the phenomenon where the signal being tested has significant close-in sidebands of the fundamental. In addition, the notch filter somewhat attenuates the harmonics.
In theory, all these factors can be compensated for, but the assumptions behind the compensation may be questionable. Also, the notch filter can introduce harmonic distortion of its own.
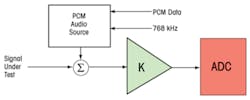
Figure 2. Simplified Block Diagram of a PCM DAC-Based Nulling Technique
A block diagram of an alternative nulling approach that avoids the limitations of notch filters and PLL synthesizers is shown in Figure 2. The LTX-Credence Data Converter Test Module, an instrument based on this technique, utilizes the high-quality PCM audio synthesizers currently available. The module requires that the frequency of the signal under test (SUT) is known or can be measured accurately.
The PCM data is generated by a mathematical engine that permits a frequency resolution of 3.5 nHz at 1 kHz and a phase resolution of 23 nanoradians. These resolutions effectively eliminate errors caused by frequency inaccuracies. The PCM audio DAC also contains internal digital filtering that simplifies the process of creating a nearly perfect sine wave from 20 Hz to 50 kHz.
The analysis of the SUT quality proceeds through the following steps:
1. K is set to a value of 1. The PCM data is set to generate no signal at the audio source output.
2. A relatively short data record is collected from the ADC and analyzed for amplitude and phase of the fundamental. This is used to generate an estimate of3. The PCM audio source input data is calculated and applied as a serial bit stream. The calculated amplitude and phase nearly match the SUT.
4. The residual signal is amplified by K where K typically is 100.
5. The residual signal is analyzed for harmonic content and noise, and the parameters6. THD, SNR, and SINAD are evaluated.
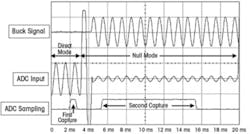
Figure 3. Scope Signals Illustrating the Measurement Technique
The effect of this sequence on the hardware is shown in Figure 3. During the first capture, the top trace shows zero signals present at the PCM audio source output while the ADC input shown in the second trace contains the SUT. The time of the first capture occupies only a fraction of a cycle of the SUT waveform. The three-parameter fit described in 1241-2000: IEEE Standard for Terminology and Test Methods for Analog-to-Digital Converters is used to extract the amplitude and phase of the SUT waveform.
After the first capture, the PCM audio DAC input is generated and the amplifier gain changed to 100. Because the extracted amplitude and phase are appropriately calculated, the residual signal is a fraction of the previous ADC input after an initial transient. The peak-to-peak ADC input during the first capture is about 2 units in height. The residual contains about 0.4 units of peak-to-peak excursion. This shows that the initial estimate was accurate to 0.1%.
The second capture takes significantly more time than the first and acquires many samples. A long data record is required to permit the harmonics to be distinguished from the noise.
As an illustration, a harmonic of -140 dB corresponds to amplitude of 0.1 µV rms relative to a 1-V rms signal. If the noise floor is to be at -160 dB, then each noise bin would be 0.01 µV. A converter with a noise floor of 1 µV over the bandwidth of interest, corresponding to an SNR of -120 dB, would require 10,000 samples.
The ADC sampling rate is about 1 MHz. The second capture period is set to measure an integer number of input signal cycles so that mathematical windowing is not required. If a curve-fit algorithm is used for the second-pass results, there can be some leakage between frequencies.
Limitations
The quality of the PCM audio source is a limiting parameter in the performance of the instrument so techniques are used to determine the harmonic distortion. As part of a calibration sequence, a notch filter measures the harmonics. The presence of four independent sets of sources and measuring hardware allows the sources to be compared as part of the verification process and permits multisite testing.
The technique supports sensitive analysis of close-in sidebands caused by low-frequency signal amplitude variations. In contrast, both the notch filter technique and the PLL technique reject the close-in sidebands.
The Data Converter Test Module contains a very high quality internal source that can be used for testing digitizers. There is some harmonic distortion, but this can be measured with the built-in notch filter.
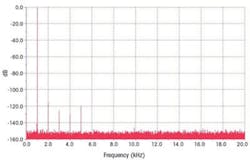
Figure 4. Spectrum of an Imperfect 1-kHz Response With Harmonics, Noise, and Skirting
Each harmonic has a separate amplitude and phase with respect to the fundamental, and the distortion measured at the digitizer-under-test output is expected to contain these. If there are differences between the expected and the measured amplitudes and phases, then the vector difference can be assigned to the device under test.
The spectrum of a high-quality, but not perfect, audio signal is shown in Figure 4. It exhibits 2nd, 3rd, 4th, and 5th harmonics. The noise floor is 14 µV rms from 20 Hz to 20 kHz. The fundamental exhibits skirting caused by a 2-µVpk-pk gain modulation and DC skirting caused by 3 µV of meander over the sample interval. The THD is -113.4 dB, the SNR 113.9 dB, and the SINAD 110.6 dB.
Conclusion
Precision sine wave measurements are a challenge when they exceed the capability of the digitizer, but the performance can be improved with a notch filter or nulling circuit. Though simple, the notch filter requires calibration, is limited to one frequency, and can be difficult to build and maintain. The AC nulling approach used in the Data Converter Test Module achieves high-precision performance at any frequency at the fastest possible measurement speeds without additional load board circuitry.
About the Authors
Carl Karandjeff graduated from Harvard University and, after a two-year stint at dBx, has worked in ATE and semiconductor test. He was a member of the M625, PLF, and BBAC design teams before joining LTX-Credence. [email protected]
Chris Hannaford holds a B.S.E.E. from Worcester Polytechnic Institute. He joined LTX-Credence in 1981 and has contributed to the design of several mixed-signal tester platforms. [email protected]
Richard Liggiero is a chief engineer at LTX-Credence. He received a B.S.E.E. from Lowell University and an M.S.E.E. degree from Northeastern University. He is a member of IEEE, Tau Beta Pi, and Eta Kappa Nu and a contributor to IEEE standards. [email protected]
Solomon Max was a founder of LTX in 1976. He earned a B.E.E. from CCNY and M.S. and E.E. degrees from MIT. He is a Senior Life Member of IEEE and a member of Sigma Xi, Tau Beta Pi, and Eta Kappa Nu. Mr. Max also is a contributor to IEEE standards and holds several patents. [email protected]
Steven J. Tilden is managing director of markets and technologies at LTX-Credence. Previously, he worked 30 years at Burr-Brown and Texas Instruments in test engineering and technology development. Mr. Tilden majored in E.E. and mathematics at the University of Maryland, is an IEEE Senior Member, and chairs the A/D and D/A standards committees. [email protected]
About the Author
Comment About the Article
To join the conversation, and become an exclusive member of Electronic Design, create an account today!

Leaders relevant to this article: